IUT Journal of Advance Research and Development

Published by
ICFAI UNIVERSITY TRIPURA
Kamalghat, Agartala-Simna Road, Pin: 799210
Website: http://www.iutripura.edu.in/
Phone: 0381-2865752/62
Fax: 0381-2865754
IUT Journal of Advance Research and Development
Published by
ICFAI UNIVERSITY TRIPURA
Kamalghat, Agartala-Simna Road, Pin: 799210
Website: http://www.iutripura.edu.in/
Phone: 0381-2865752/62
Fax: 0381-2865754
Editorial Board:
Chairman of the Editorial Board: Prof. Biplab Halder- Pro VC, ICFAI University, Tripura
Chief Editor: Dr. A.K.Ray, Dean, Research and Academic, ICFAI University, Tripura
Members of the Editorial Board:
Dr. Bijoy Krishna Bhattacharya- Professor, Faculty of Management Studies, ICFAI University, Tripura
Dr. Priyanshu Borthakur- Associate Professor, Faculty of Science and Technology, ICFAI University, Tripura
Dr. Dhananjoy Datta- Assistant Professor, Faculty of Management Studies, ICFAI University, Tripura
Dr. Sukanta Sarkar- Assistant Professor, Faculty of Management Studies, ICFAI University, Tripura
Dr. Y.C. Singh- Assistant Professor, Faculty of Educatiobn, ICFAI University, Tripura
Dr. Umakant Mishra- Assistant Professor, Faculty of Science and Technology, ICFAI University, Tripura
Dr. Sobodh Debberma- Assistant Professor, Faculty of Science and Technology, ICFAI University, Tripura
Prof. Zigisha Poojari- Assistant Professor, Faculty of Law, ICFAI University, Tripura
Prof. Apurba Chakraborty - Assistant Professor, Faculty of Science and Technology, ICFAI University, Tripura
Prof. Shubhrangshu Purkayastha- Assistant Professor, Faculty of Science and Technology, ICFAI University, Tripura
Prof. Debjani Bhowmik- Assistant Professor, Faculty of Science and Technology, ICFAI University, Tripura
Prof. Sudip Bhattacharjee - Assistant Professor, Faculty of Management Studies, ICFAI University, Tripura
Advisory Board:
Professor (Dr) U .Misra- Department of Civil Engineering,
Dr.Amit Kar- Principal Scientist, IAIR New Delhi
Dr. N.Das- Principal Scientist, IGFRI Jhanshi, Uttar Pradesh
Dr. Purusottam Sharma- Principal Scientist, IGFRI Jhanshi, Uttar Pradesh
Dr. N.G.Pendse- Professor, Department of Economics, Rani Durgabati University, Jabalpur, Madhra Pradesh
Dr. R.Prasad- Professor, Department of Economics, Pandit Ravishankar Shukla University, Raipur, Chhattisgarh
Dr. Rakesh. A. Joshi- Associate Professor, Department of Economics, Saurashtra University, Gujarat
Dr. R.P. Sharma, Professor & Dean, NIT Agartala,Tripura
Contents
|
Sl. No. |
Paper Title |
Page Number |
|
1 |
Women Empowerment to Lead Change- Bangladesh Perspective · Shukla Rani Basak, Anil Chandra Basak and Mohammed Ataur Rahman |
1-17 |
|
2 |
Agriculture and Allied Micro- Enterprises for Sustainable Livelihood Development of Women and Men in Watershed Areas of Tripura · Dr.A.K.Ray |
18-28 |
|
3 |
Women Empowerment and the Constitution of India · Dr. Shimla |
29-36 |
|
4 |
Employment Diversification by Female Compared to Male workers: Some Quantitative and Qualitative Aspects · Dr. Chitrita Bhowmick and Samprit Chakrabarti |
37-71 |
|
5 |
A Study on Women Empowerment in Education and Health Sector · Dr. S. Manikandan |
72-85 |
|
6 |
Economic empowerment of Indian women: An analysis
|
86-99 |
|
7 |
Femvertising: An Innovative Way of Women Empowerment
|
100-114 |
|
8 |
Half-Widows in Jammu and Kashmir: A Major Violation of Human Rights
|
115-124 |
Focus
Dear Readers,
We feel proud to bring forth second issue of the on line IUT Journal of Research and Development. “I measure the progress of a community by the degree of progress which women had achieved” – Said Dr. B.R Ambedkar. Keeping in tune with this noble idea, the second issue of IUT JARD has addressed several contemporary issues on women empowerment.
This issue commence with a paper entitled “ Women Empowerment to Lead Change Bangladesh Perspective” by Shukla Rani Basak, Anil Chandra Basak and Mohammed Ataur Rahman, The findings of this paper was that Bangladeshi women are marching forward but it is essential to provide them more support so that those who are living in rural Bangladesh can make their presence felt in all spheres of national life.
The second paper by Dr. A.K.Ray on “Agriculture and Allied Micro- Enterprises for Sustainable Livelihood Development of Women and Men in Watershed Areas of Tripura”, stated that agriculture and allied enterprises should be viewed as an alternative main stream non-farm employment opportunities and although not the perfect way of provided employment to the poor men and women.
The third paper entitled “Women Empowerment and the Constitution of India”by Dr.Shimla opined that the constitution has provided all kinds of opportunities for women empowerment and their safeguard. With equal rights and opportunities opened to them, they can and they are participating fully in economic life across all sectors.
The fourth paper on “Employment Diversification by Female Compared to Male Workers: Some Quantitative and Qualitative Aspects” by Dr.Chitita Bhowmick And Samprit Chakrabarti focused on quantitative and qualitative aspects of employment which also provided some additional insight on the trends and pattern of female employment in India vis-à-vis West Bengal.
The fifth paper by Dr. S. Manikandan on” A Study on Women Empowerment in Education and Health Sector” suggested that the Government should create special policies and financial supports for female members. In present conditions the empowerment of women is necessary as well as sufficient condition for Indian economic development.
The sixth paper on ‘Economic Empowerment of Indian women: An Analysis by ”Ms. Adwitiya Gope and Mr. Arjun Gope focused on the facts that female economic condition has not yet been remarkable in India mainly due to less female labour force participation. In the seventh paper entitled “Femveriising: an Innovative Way of Women “Ms. Puja Thapa gives an overview of effectiveness of femvertising to empower the women of this era.
Dr. Sukanta Sarkar’s paper was on “-Half Widows in Jammu and Kash: A Major Violation of Human Rights”. This paper was written with the objective to examine impact of violence in J&K. The authors concluded that the continuance violence in J&K is hampering and obstructing the empowerment of women in the state.
Dr.A.K.Ray
(Chief Editor)
Women Empowerment to Lead Change- Bangladesh Perspective
Shukla Rani Basak1, Anil Chandra Basak2 and Mohammed Ataur Rahman3
1 Shukla Rani Basak: Senior Research Officer, Bangladesh Forest Research Institute, Chittagong, Bangladesh Email: sr.basak@yahoo.com
2 Anil Chandra Basak: Professor, College of Agricultural Sciences, IUBAT University, Uttara, Dhaka 1230, Bangladesh
Email: acbasak@iubat.edu
3 Mohammed Ataur Rahman: Professor and Director, Centre for Global Environmental Culture (CGEC), IUBAT University, Uttara, Dhaka-1230, Bangladesh. Email: marahman@iubat.edu
Abstract
Densely populated Bangladesh has shown tremendous advancement in empowering women in the society and bringing changes in traditional and conservative male dominated society. It was hardly believable in fifty years back that the women are working outdoors. Today more than four and a half million females are working in the garments industries alone. Their income is the major support for the family and thus the women are taking leadership in the family as well as in the societies. Many women entrepreneurs both in the cities and rural areas are growing. Women in education, politics, business, social development, agriculture, fisheries and other fields have significantly been increased. Women in administration, transportation, civil aviation, police and armed forces etc. are contributing largely. In the cultural sectors women have already dominated over the men. Moreover, women are the leaders of the houses as well as caring the family with love and affection and performing the ultimate leadership of the changes and development.
Keywords: Women Empowerment, Entrepreneurs, Equal opportunity, Decision-making, Disparities, Sustainable Development Goals and Challenges
Introduction
At birth: 1.04 male(s)/female
0-14 years: 1.03
male(s)/female
15-24 years: 0.88
male(s)/female
25-54 years: 0.9
male(s)/female
55-64 years: 0.95
male(s)/female
65 years and over: 0.96
male(s)/female
Total population: 0.95
male(s)/female (2014 est., CIA World Factbook 2015)
In Indian Sub-Continent, women are always dominated by the men and men always lead the women in almost every field of life (Aslam and Naseem, 2015). In ancient Rome, women were considered as men’s property and they treated them in their own way (Corrick, 2011). Before the independence, the status of women in Bangladesh was in a very disadvantageous position in the male-dominating society. Women, in custom and practice, remained subordinate to male in almost all aspects of their lives. Most women’s lives remained centred on their traditional roles and they had limited access to markets, productive services, education, health care, and in administration and local government. At the household level, the girl often had unequal access to nutrition, health care and education compared to boy. Many discriminatory practices arose out of some deep-rooted socio-cultural factors. Women earned less than men and were mostly engaged in low paid jobs. They often did not have easy access to credit and other income generation opportunities, and still are not represented proportionately at management and policy levels.
However, the status of women changes with the passage of time as with the development in the world, the status of women in Bangladesh also has developed noticeably during recent times. In education and working sectors, Bangladesh has made great progress in girls’ education. The proportion of girls enrolled in primary school increased from 51 per cent in 1991 to 94 per cent in 2007. There are also substantially more female primary school teachers and their role is very encouraging. Girls comprise more than 60 per cent of students enrolled in UNICEF’s basic education programs for working children. These girls now have the necessary life skills to apply to their day-to-day challenges, and are able to read and write basic text and perform simple arithmetic calculations. By November 2009, about 46,000 (out of 166,000) learners had graduated from the 40-month basic education course (UNICEF Bangladesh-2010).
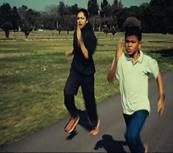
A strong and confident woman can bring change in the society and men are bound to accept the opinions of the women. Still there are problems in some societies where women are deprived of getting their rights. They face tremendous obstacles from different corners and cannot apply their inherent efficiency. Both male and female are the part of society and have equal importance so that the balance between genders proceeds to the achievement of goals for a better society and bright future for generations to come. As women hold a major share of the population and take the primary responsibility of caring the generation, without their participation it is impossible to create a sustainable society and it cannot fulfil the targets of Sustainable Development Goals (SDG) 2030. In this context, this paper analyses some important successes of the women and the challenges to achieve the changes.
Methodology
This study was conducted using the information from different research articles and in peer reviewed journals or periodicals, grey literatures published in different forms, news media, folklore and local records etc. Information has also been gathered from the workshops, seminars and visiting administrative organizations, social and human affairs centres. More importantly, some information has been collected directly from the stakeholders, rural and urban administrative bodies, civil societies, NGOs, women and youth communities. Electronic media were also important sources for generating information.
Status of women in Bangladesh
Women in Bangladesh have made major strides over the past decades, putting the South Asian country at the forefront among the least-developed countries in addressing gender disparity. Since the World Conference on Women in Mexico in 1975 – which was a milestone in the battle for equality – Bangladesh has been at the forefront among the least-developed countries (LDCs) in addressing gender disparities. Bangladesh has the eighth lowest gender gap in political empowerment in the world. This is partially due to the fact that it has had a female head of state for longer than any other country in the world. In addition, the proportion of seats held by women in the national parliament doubled from 10 per cent in 1990 to 20 per cent in 2011 (ILO Report 2014). Women’s growing presence in the political sphere has had important implications on the family structure. Society is moving forward from the traditional view that women are an economic liability and sons are more desirable than daughters. Studies show that the growing independence of women is one of the major causes of a decline in the “missing women” phenomenon – gender based infanticide – in Bangladesh.
At present, women have
joined in the fields of risky and challenging jobs like defense, Boarder Guard
of Bangladesh (BGB), police, airlines pilot, drivers of train, bus, taxi, three
wheelers; in building construction, brick fields and also in fire service etc.
They are also participating as athletes, in games and sports like cricket,
football, wresting, shooting and kabadi etc.
In the economic sphere, women have played a vital role as well, as evidenced by
the importance of the ready-made garment (RMG) sector (Fig. 1). The RMG
industry has been placed as the largest export earner of Bangladesh where more
than 5000 garment factories are running, employing over four million people of
which more than 80% workers are women. RMG industry is considered as the
backbone of the country’s economy, the main strength of RMG sector in Bangladesh
is female workers (Farhana et. al. 2015). Moreover, the economic success
of Bangladesh during the last two decades is mainly due to the exports of RMG
to Europe and North America.
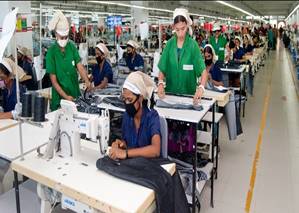
Fig. 1 Working women in Garments Factory
Despite the fact that women do not generally have ownership over land and tools necessary for agriculture, their labor has been a vital part of the success Bangladesh has had in agricultural productivity – the country stands out compared with other countries in Asia in terms of enhancing agricultural productivity (ILO-2014). In addition, Bangladesh has experienced significant improvements in women’s health over the past three decades. Women’s life expectancy, for example, has increased from 54.3 years in 1980 to 69.3 years in 2010, one of the largest increases in the region.
In
the social sphere, Bangladesh is a textbook example of what is possible when
women are involved in decision-making. Indeed, it is an inspirational story of
social innovation and development, in no small part due to the help of
microfinance, which has played an integral role in rural and social development
in Bangladesh – 92 % of the borrowers are women and 90 per cent live in rural
areas. While there is some debate over the efficacy of microfinance in poverty
reduction, studies have shown that in Bangladesh, female participation in
microfinance activities has led to an increased sense of empowerment, measured
by factors such as decision-making, social acceptance and political
involvement, which in turn have improved general welfare.
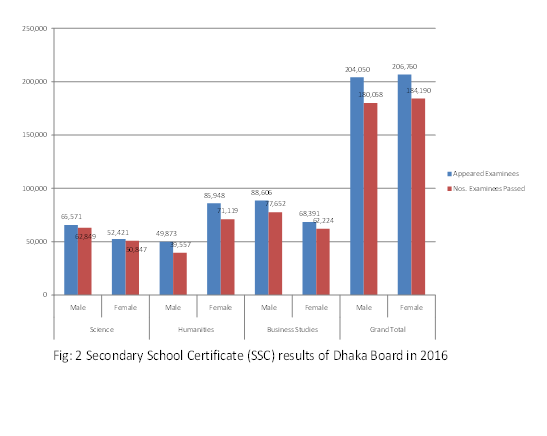
Bangladeshi mothers are participating increasingly on their children’s
education by choice. The country has managed to reduce the gender gap at all
levels of education, particularly at primary and secondary education, i.e. in
youth literacy and secondary school enrolments. With the continuous efforts,
the girls are doing better results (Table 2). In these two areas, disparities
have been reduced at a faster rate in Bangladesh than the global average
(ILO-2014).
|
|
Table 2 Secondary School Certificate (SSC) results of Dhaka Board in 2016
|
Group |
Male/Female |
Total Examinees |
Appeared Examinees |
No. Examinees Securing Minimum Grade Point |
|
|
Nos. Examinees |
% |
||||
|
Science |
Male |
65,668 |
65,571 |
62,849 |
95.85 |
|
Female |
52,511 |
52,421 |
50,847 |
97.00 |
|
|
Total |
118,179 |
117,992 |
113,696 |
96.36 |
|
|
Humanities |
Male |
50,030 |
49,873 |
39,557 |
79.32 |
|
Female |
86,342 |
85,948 |
71,119 |
82.75 |
|
|
Total |
136,372 |
135,821 |
110,676 |
81.49 |
|
|
Business Studies |
Male |
88,860 |
88,606 |
77,652 |
87.64 |
|
Female |
68,690 |
68,391 |
62,224 |
90.98 |
|
|
Total |
157,550 |
156,997 |
139,876 |
89.09 |
|
|
Total Male |
|
204,558 |
204,050 |
180,058 |
88.24 |
|
Total Female |
|
207,543 |
206,760 |
184,190 |
89.08 |
|
Grand Total |
|
412,101 |
410,810 |
364,248 |
88.67 |
United Nations General Assembly in its Seventieth session on 21 October 2015 adopted the following outcome document of the United Nations summit for the adoption of the post-2015 development agenda: Transforming our world: the 2030 Agenda for Sustainable Development where the SDG Goal No. 5 explains the agenda for empowering all women and girls (UNGA-2015).
Goal 5 Achieve gender equality and empower all women and girls
5.1 End all forms of discrimination against all women and girls everywhere
5.2 Eliminate all forms of violence against all women and girls in the public and private spheres, including trafficking and sexual and other types of exploitation
5.3 Eliminate all harmful practices, such as child, early and forced marriage and female genital mutilation
5.4 Recognize and value unpaid care and domestic work through the provision of public services, infrastructure and social protection policies and the promotion of shared responsibility within the household and the family as nationally appropriate
5.5 Ensure women’s full and effective participation and equal opportunities for leadership at all levels of decision-making in political, economic and public life
5.6 Ensure universal access to sexual and reproductive health and reproductive rights as agreed in accordance with the Program of Action of the International Conference on Population and Development and the Beijing Platform for Action and the outcome documents of their review conferences
5.a Undertake reforms to give women equal rights to economic resources, as well as access to ownership and control over land and other forms of property, financial services, inheritance and natural resources, in accordance with national laws
5. b Enhance the use of enabling technology, in particular information and communications technology, to promote the empowerment of women
5. c Adopt and strengthen sound policies and enforce able legislation for the promotion of gender equality and the empowerment of all women and girls at all levels
Yet, Bangladeshi women continue to face many challenges. The recent industrial
disasters in the RMG sector, where a large majority of workers are women,
highlight the serious concerns about occupational safety and health. The
Bangladesh government, employers and workers organizations are making important
strides in the right direction, with the support of the ILO and many
development partners, but still a lot needs to be done. Women also have been
getting the short end of the stick in the labor market. The employment rate of
women in 2010, at 58 per cent, was close to 30 percentage points lower than the
rate for men. Women are also disproportionately affected by unemployment,
underemployment and vulnerable employment (Fig. 3).

Fig. 3 Factors affecting women empowerment in Bangladesh (Naz- 2006)
The devaluation of women labor in labor market also hinders women right. The things should consider for the development of women empowerment in Bangladesh are as below:
• To understand the importance about the role of
women in the development of the society.
• To know the obstacles and the causes of obstacles.
• To know the obstacles women face in the field of work.
• To know the social attitude towards women’s independence.
The dignity of women, socio-economic and political developments are considered in reflecting their empowerment. Many women in Bangladesh consider in erotic social value, superstition and are dependent on men. Usually girls are not properly taken care of the birth of male child is welcome. The other causes behind the less empowerment of women in Bangladesh are their age, marriage system, relationship and motherhood. Usually, the father turns down mother’s decision in selecting the bridegroom.
UNDP focuses on gender equality and women’s empowerment not only as human rights, but also because they are a pathway to achieving the Millennium Development Goals and sustainable development. The women of Bangladesh are no more only house-wives and inside workers. They have come out from the home and took the challenges to change the economy, politics, and social culture of Bangladesh very rapidly. These activate attention of developed countries towards Bangladesh. Now, Bangladesh is a role model of women empowerment and development in the world map. Bangladesh faces big challenges in religious and cultural aspects but the powerful and dedicated women have taken the challenges and crossed the barriers.
Women empowerment: Empowerment of women is such a process which controls women rights, challenges and gender disparity in parental and social institutions. The socio-economic condition refers to the social dignity, educational qualifications, family marriage system, mother, social value, occupation salary and wealth etc. The Bangladeshi women have made massive gains since the country achieved its independence in 1971. During the last four decades a significant achievement has been recorded in political empowerment, better job prospects, improved education and the adoption of new laws to protect their rights. As of 2013, the Prime Minister of Bangladesh, the Speaker of Parliament, the Leader of the Opposition and the Foreign minister were women. However, issues like domestic violence and rape are still prevailing in some backward societies. The government and other activists are trying to mitigate these problems.
Earlier, many women`s lives remained centered on their traditional roles, and they had limited access to markets, productive services, education, healthcare, and local government. This lack of opportunities contributed to high fertility patterns, which diminished family well-being, contributed to the malnourishment and generally poor health of children, and frustrated educational and other national development goals. In fact, poverty was the main hindrance to get access to health care, education, and training etc. But the government of Bangladesh has taken massive steps to drive forward the women and helping women to establish their rights resulting in a big change in women empowerment.
Empowerment in
international development
The UK`s Department for International Development is working to address constraints to the empowerment of adolescent girls in developing countries. Researchers mapped organizations that competitively seek innovative ideas from both the private and non-profit sectors potentially to reach girls, youth or women in developing country contexts and provides support in the forms of finance and technical assistance to bring their ideas to market.
In 2008, Africa began the Initiative for the Economic Empowerment of Women Entrepreneurs Project (IEEWEP) with funding by ExxonMobil. The goal of the project was to increase women’s income and participation in local business in Southern Chad. In a society that relies heavily on agriculture, IEEWEP streamlined the way women farmed and took their goods to market by training them on better agricultural practices and opening two new agro-processing centres. In the past three years, more than 1,000 women have worked through a graduated business development project, which has diversified their income sources and increased their annual income by approximately 70% (Africare-2016).
A Successful Empowerment: The women working in the households are contributing a lot to the family although they are not recognized in terms of economy. They are the leaders of the homes and are not under suppression although some of the so-called organizations claim them as captives. So, women working in homes or are self-employed, need recognition for their great contribution to the society.
According to Ms. Alaka Basu, Senior Fellow, Women and Population, United Nations Foundation, empowerment is defined as an expansion of agency throughout women’s lives, not in individual sectors; expansion of choice according to women’s rules. “Even ‘bad’ behaviors can be an outcome of expanded choice.” Baldwin applauded Basu’s message about expanding the traditional approach to empowerment, urging organizations to “unpack the concepts” behind their goals to determine what they define as successful empowerment (Risingbd.com-2014).
Women and Politics - Women Empowerment in Bangladesh: In comparison to other countries, women’s
participation was only 2% (Table 3) in 2001. However, due to
increasing involvement and eagerness, the women’s participation has increased
dramatically and in the 10th parliament (2014) the women
participation is 20.29%.
Table 3 Women in National Parliaments in Selected countries
|
Rank |
Country |
Elections |
% of women |
|
1 |
Rwanda |
2003 |
48.8 |
|
2 |
Sweden |
2002 |
45.3 |
|
3 |
Norway |
2001 |
38.2 |
|
23 |
Australia |
2004 |
24.7 |
|
49 |
UK |
2001 |
18.1 |
|
59 |
USA |
2004 |
15.0 |
|
93 |
India |
2004 |
8.3 |
|
98 |
Japan |
2003 |
7.1 |
|
122 |
Bangladesh |
2001 |
2.0 |
Source: Inter-Parliamentary Union, Women in National
Parliaments (February 28, 2005).
The current Commonwealth Plan of Action for Gender Equality 2005–2015 (PoA)1
and post-2015 Commonwealth gender priorities draw on international commitments
for the realization of women’s rights enshrined in the Convention on the Elimination of all Forms of Discrimination
Against Women (CEDAW), the Beijing Platform for
Action, the Sustainable Development Goals 2030, UN Security Resolution 1325 and
follow-up resolutions, and other agreements on health and education targets.
The millennium development goals and other international instruments have been
acting as catalysts to increase the representation of women in leadership roles
and decision-making positions by 2015. The United Nations and the Commonwealth
Secretariat have committed to assisting their member countries to reach gender
equality within the prescribed time frame. International organizations,
development institutions and civil society have also contributed to reaching
these global commitments. The PoA recommends member countries to achieve a
target of no less than 30% of women in decision-making in the political, public
and private sectors by 2015; the Commonwealth still faces challenge in reaching
this target.
Current situation of women in leadership
Global statistics reveal that women continue to be under-represented in national parliaments, in 2015, 22 percent of all national parliamentarians were female, a slow increase from 11.3 percent in 1995. The share of women among Ministers now averages at 17%. The highest positions are even more elusive; as of August 2015, 11 women served as Head of State and 13 served as Head of Government. Five are currently from Commonwealth countries: Prime Ministers’ Sheikh Hasina of Bangladesh, Portia Simpson-Miller of Jamaica, and Saara Kuugongelwa Amadhila of Namibia, and Presidents’ Marie-Louise Coleiro Preca of Malta and Ameenah Gurib-Fakim of Mauritius (IPU-2014). Furthermore, HM Queen Elizabeth II has been represented by women Governor-Generals in Antigua and Barbuda, Australia, the Bahamas, Barbados, Canada, Grenada, New Zealand and St Lucia. It is noteworthy to share the significance of the first female Chair of the Commonwealth, Prime Minister Persad Bissessar of Trinidad and Tobago in 2010, who handed over to another female leader, the Prime Minister Gillard of Australia in 2011. From 2010–2014, women leaders were re-elected and/or appointed as Deputy/Vice Presidents in Bangladesh, Dominica, Guyana, Kiribati, Malawi, Mauritius, Singapore, Trinidad and Tobago, and recently Zambia.
Many women have held ministerial positions beyond gender portfolios, such as foreign affairs, finance, defense, environment, public service, energy, justice, etc., positions which have been traditionally held by men. The political appointments of women in cabinets as ministers vary across the Commonwealth.
Rankings
Gender Inequality Index
in SAARC Countries: According to the UN Development Programme`s Human
Development Report for 2015, Bangladesh ranks 111 out of 188 countries on its
Gender Development Index; and 67 out of 75 on the Gender Empowerment Measure, a
measure of gender inequality in economic and political terms(Table4).
Table
4 Gender Inequality Index in SAARC Countries
|
Country
|
Gender Inequality Index 2014 |
|
Parliamentary Seats % held by Women 2014 |
Secondary Education % Female 2013 |
Labor Work Force % Female 2013 |
|
Value |
Rank |
||||
|
Maldives |
0.243 |
49 |
5.9 |
27.3 |
56.2 |
|
Sri Lanka |
0.370 |
72 |
5.8 |
72.7 |
35.1 |
|
Bhutan |
0.457 |
97 |
8.3 |
34.0 |
66.7 |
|
Nepal |
0.489 |
108 |
29.5 |
17.7 |
79.9 |
|
Bangladesh |
0.503 |
111 |
20.21 |
34.1 |
57.4 |
|
Pakistan |
0.536 |
121 |
19.7 |
19.3 |
24.6 |
|
India |
0.563 |
130 |
12.2 |
56.6 |
27.0 |
|
Afghanistan |
0.693 |
152 |
27.6 |
5.9 |
15.8 |
Results and Discussion
From the study it reveals that the following actions are very important for promoting women empowerment:
1. Family support: Family support is the most important for helping women to come out from the barriers and hinders of social and religious bindings. The parents should encourage the girls in getting education, to participate in socio-cultural activities and to develop them both mentally and physically providing equal opportunities for both boys and girls.
2. Education: Education is the basic right for development of human being to acquire knowledge for management of natural resources for the wellbeing of all lives on the earth. According to UN Agenda 2030 Sustainable development “Goal No. 4 Ensure inclusive and equitable quality education and promote lifelong learning opportunities for all” under which by 2030 it should be ensured that all girls and boys complete free, equitable and quality primary and secondary education leading to relevant and effective learning outcomes; all girls and boys have access to quality early childhood development, care and pre-primary education and so on (UN SDG Agenda 2030). Bangladesh has already been implemented free education up to secondary level for the girls.
3. Social Support: Without congenial and peaceful social atmosphere, it is not possible to empower the women. According to UN Agenda 2030 “SDG No. 16 Promote peaceful and inclusive societies for sustainable development, provide access to justice for all and build effective, accountable and inclusive institutions at all levels, it is the obligation of the society to support the womenfolk to empower”.
4. Government’s facilities: The government should provide support with reserve quota in education, employment and leadership to equalize the women’s position in the mainstream. It is urgent to make laws and ordinances especially for women’s security such as humiliation, sex abuse, eve-teasing, violence and child marriage etc. Facilities like maternity leave, baby care, transportation to and from working places, academic and training institutes and recreational places etc. to be provided. According to SDG 5.a reforms should be undertaken to give women equal rights to economic resources, as well as access to ownership and control over land and other forms of property, financial services, inheritance and natural resources, in accordance with national laws.
5. Self motivation and determination: Self motivation and determination of women are also very important to gain mental courage to overcome the obstacles for achieving their rights in the social and working arena. According to Diane Mariechild, “A woman is the full circle. Within her is the power to create, nurture and transform”. One of the most courageous things you can do is identify yourself, know who you are, what you believe in and where you want to go — Sheila Murray Bethel. According to Margaret Sanger, “Woman must not accept; she must challenge. She must not be awed by that which has been built up around her; she must reverence that woman in her which struggles for expression” (Psychology Today 2013).
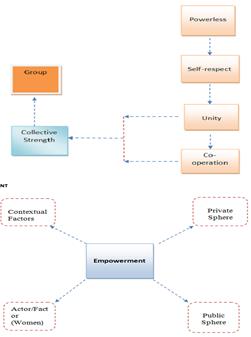
Fig 4 Women Change from feeling weak to strong (Hossain 2015)
6. Correct explanations of religious and spiritual norms: In Indian Sub-Continent the religious and spiritual norms are very influential in the social activities. In many cases, misinterpretation of religious explanations misguides the common people; as a result women are harassed and suppressed. A social action plan is necessary for correct explanation and execution of these complicated norms.
Strategies to increase women’s representation in decision-making (Fig 5)
Electoral and political reform– The most popular electoral model widely practiced across the Commonwealth is the First Past the Post/simple majority electoral models, considered to support the incumbent, and not favorable to women’s political candidacy. Markedly, electoral reform and introduction of quotas into political party structures has brought about the rise of women’s representation in many Commonwealth countries (Commonwealth report 2015) ISBN 978-1-84929-109-5
 Quotas
used in politics –
Over
70 countries globally have adopted alternative forms of quotas, which have
advanced the participation of women in decision-making. There are three notable
types of gender quotas used in politics: 1) reserved seats (constitutional
and/or legislative); 2) legal candidate quotas and/or reserved constituencies
(constitutional and/or legislative); and 3) Political party quotas (voluntary).
A combination of quotas with the first past the post electoral model has proved
effective in fast-tracking the representation of women in Bangladesh, India,
Rwanda and Uganda. Reserved constituencies and/or reserved seats for women to
contest independently and by
Quotas
used in politics –
Over
70 countries globally have adopted alternative forms of quotas, which have
advanced the participation of women in decision-making. There are three notable
types of gender quotas used in politics: 1) reserved seats (constitutional
and/or legislative); 2) legal candidate quotas and/or reserved constituencies
(constitutional and/or legislative); and 3) Political party quotas (voluntary).
A combination of quotas with the first past the post electoral model has proved
effective in fast-tracking the representation of women in Bangladesh, India,
Rwanda and Uganda. Reserved constituencies and/or reserved seats for women to
contest independently and by
direct election has worked in the Rwanda, Swaziland and Uganda national elections, and in Bangladesh, India and Lesotho local governance.
Capacity building for women – Bangladesh has provided leadership and management training for women to ‘build the capacity of female political aspirants’ as well as to equip them with qualities such as ‘self-confidence and assertiveness’ as most agree that “economic disadvantage impedes equal participation”. Thus awareness creation and training activities are being used to sensitize societies to the need to vote for women across Bangladesh. It has succeeded in strengthening the representation of women in local governance without introducing affirmative action policies; through civil society capacity building efforts for women interested in local governance.
Adoption and Implementation of national gender policies – Bangladesh has adopted and implementing national gender policies and has guaranteed equal rights for men and women.
Financial Resources – Many women are limited by financial resources which further inhibit their effective participation in politics. A dedicated fund should be set aside through state or party mandates to support women’s advocacy and political campaigns. Women entrepreneurs can also serve as donors to support women’s electoral campaigns.
Mass mobilization of women– Apart from legal or electoral reforms, a mass mobilization of women can lobby political parties to mainstream women in party manifestoes and electoral campaigns. Women are known to be the highest number of voters in any election, and can exchange their votes for positive action.
Target accomplished women to join politics– Government and civil society groups can target accomplished, competent and qualified women leaders and groom them for political leadership.
These women have established families with reduced family responsibilities, wide experience, and loyal constituency and are financially stable. These women can also be mentored by other women in political authority. Appointing women leaders into positions of authority has proved effective in many Commonwealth countries.
Involving male champions– Practically it is important to partner with men who have long-standing control of power, and sensitize them to understand gender equity, equality and mainstreaming. In this way, male champions can serve as agents for change for the inclusion and effective participation of women at all levels and across all sectors including the home. Affirmative action for women representation at all decision-making levels remains a challenge, seen as positive action for women at the detriment of men.
Conclusions and Recommendations
Despite the fact that women’s development has been accorded priority by different governments in the consecutive Five-Year Plans of Bangladesh, women continue to be disadvantaged, deprived, neglected, and face discrimination even after 42 years of independence. The society is male-dominated while women are poverty-stricken and continue to be victims of domestic violence and abandonment. In spite of constitutional guarantees, women have not enjoyed the same equal rights as men as accorded to them. At the onset of the new millennium, the percentage of female representation at both the local and national level has remained low compared to global standards.
It is obvious that the people of Bangladesh are changing their mindsets in connection with global context and they are showing more respect to women and giving them priority to take part in all levels of development. Without participation of women, Bangladesh can never be a Sonar Bangla. So the women should be supported all the way to establish their empowerment to lead change in Bangladesh.
Educating a woman is actually educating a family; educated women are more conscious of the world surrounding them. They are responsive to the negative impact of having too many children and health and hygiene issues. Increasing rate of literacy among women reduces fertility rate. Education empowers them, helps to achieve economic freedom and it is directly linked with poverty reduction.
Bangladeshi women are marching forward but it is essential to provide them more support so that those who are living in rural Bangladesh can make their presence felt in all spheres of national life. The government is doing its best to increase literacy among women so that they do not lag behind in any respect. However, it is utmost essential to prevent child marriage, dowry related violence and sexual harassment from the society. It needs to rise together and spread the light of education which will empower women to be able to put more effort to nation building (Financial Express May 19, 2016).
Reference
1. Africare-2016: Empowering New Business women in Chad: IEEWEP https://www.africare.org/africares-approach/womens-empowerment/
2. Aslam, F. and Naseem, F. 2015, Political and Social Status of Women in Indo-Pak Subcontinent Berkeley Journal of Social Sciences Vol. 5, Spring 2015 http://www.berkeleyjournalofsocialsciences.com/spring2015-5.pdf
3. CIA World Factbook - last updated on June 30, 2015 http://www.indexmundi.com/bangladesh/sex_ratio.html
4. Corrick, J. (2011). The Bloody, Rotten Roman Empire: The Disgusting Details About Life ... Capstone Classroom http://www.berkeleyjournalofsocialsciences.com/spring2015-5.pdf
5. Demographics of Bangladesh; Wikipediahttps://en.wikipedia.org/wiki/Demographics_of_Bangladesh
6. Farhana, K., Sayduzzaman M. and Munir MS 2015 Present status of workers in Readymade garments Industries in Bangladesh; European Scientific Journal March 2015 edition vol.11, No.7 ISSN:1857 – 7881(Print)e - ISSN1857- 7431
7. Financial Express 2016: http://www.thefinancialexpress-bd.com/2016/05/19/30952/Education-and-women's-status-in-society
8. Hossain, ANMZ 2015: Women Empowerment in Rural Local Government of Bangladesh, International J. Innovation and Applied Studies; ISSN 2028-9324 Vol. 10 No. 2 2015 pp 584-593 http://www.ijias.issr-journals.org/
9. ILO Report 2014: A quiet revolution: Women in Bangladesh
10. IPU— Inter Parliamentary Union 2014 Women in Parliament: 20 years in review http://www.ipu.org/pdf/publications/WIP20Y-en.pdf accessed on 12th June 2016
11. Naz, F. 2006: Pathway of Women’s Empowerment in Bangladesh, AHD Publishing House, Dhaka 2006, p 17
12. Psychology Today 2013: 18 Inspirational & Empowering Quotes for Women https://www.psychologytoday.com/blog/communication-success/201308/18-inspirational-empowering-quotes-women
13. Risingbd.com-2014 http://www.risingbd.com/english/Womens_empowerment_in_Bangladesh_A_secret_of_progress/11937 Published: 24 Jan 2014 03:17:54 AM Friday || Updated: 24 Jan 2014 11:03:14 AM Friday
14. Tanmoy, R. 2009. The Caste System in Bengal-Scribd; https://www.scribd.com/doc/43746419/The-Caste-System-in-Bengal accessed on 17 June, 2016
15. The Commonwealth Plan of Action for Gender Equality 2005–2015. Commonwealth Secretariat, 2015 http://www.thecommonwealth.org/Internal/33902/38116/poa_2005_2015/
16. The Commonwealth report 2015; Gender and Political Development: Women and Political Leadership in The Commonwealth; thecommonwealth.org ISBN 978-1-84929-109-5
17. UNICEF Bangladesh-2010 Women and girls in Bangladesh http://www.unicef.org/bangladesh/Women_and_girls_in_Bangladesh.pdf
18. United Nations Development Programme Human Development Reports 2015 http://hdr.undp.org/en/composite/GII
19. UNGA—United Nations General Assembly 2015 A/RES/70/1 Seventieth session Resolution adopted by the General Assembly on 25 September 2015 70/1. Transforming our world: the 2030 Agenda for Sustainable Development http://www.un.org/ga/search/view_doc.asp?symbol=A/RES/70/1&Lang=E
Agriculture and Allied Micro- Enterprises for Sustainable Livelihood Development of Women and Men in Watershed Areas of Tripura
Dr.A.K.Ray
Dean { Research & Academic) ,ICFAI University, Tripura.
Abstract:
Agriculture allied enterprises should be viewed as an alternative main stream non-farm employment opportunities and although not the perfect way of providing employment to the poor. Therefore, there is an urgent need to understand how watershed development can become a part of efforts to support most diverse livelihood portfolios where a win-win situation can be created through improving the resource base which creates a more conducive environment for undertaking micro-enterprise activities, leading to an overall increase in standard of living, employment, poverty reduction and building resilience of community to cope with the impacts of drought.
Key Words: Agriculture, livelihood, rural population, small farmers, marginal farmers.
Introduction:
Agriculture and activities support livelihood of nearly 70 percent of India’s rural population (Hiremath 2007). In recent years, land based agriculture of small and marginal farmers are increasingly becoming unsustainable, since their increasingly fragmented land has not been able to support the food, fodder, educational and other requirements of the family. As a result , rural household are forced to look at alternative means for their livelihood opportunities .In this context natural resources based micro enterprises have emerged as a key alternative for supporting their livelihood , both for small and marginal farmers and landless labourers .Therefore ,the poverty alleviation in a state like Tripura , requires a greater understanding of the interactions of agriculture and allied enterprises and their implications for the small an marginal farmers and land less families . Varying socio economic and environmental increased the demand for alternative sources of income for the poor village people of this state.
Watershed development is a strategy for sustainable growth in the vast rain fed areas, to enhance agricultural production, conservation and development of natural resources and raising rural livelihood in Tripura. Traditionally watershed has been viewed as hydrological units to conserve soil and water and a compartmental approach has been adopted. However, recent idea is that through the integrated approach all natural resources are to be managed efficiently so that rural livelihood can be improved sustainably and substantially through various activities. Therefore, this study attempt to examine the following
Objectives:
1. To examine the role of market structure in improving the livelihood of small and marginal farmers and agricultural labourers in the study areas.
2. To examine the impact of technological changes on the livelihood of poor farmers and agricultural labourers , of Tripura , and
3. To examine the role of income generating micro enterprise in improving the livelihood of poor farmers and agricultural labourers of this state.
Data Collection:
Data has been collected from various secondary sources like records,documents etc.of GOIand Tripura Government.
Micro-Enterprises, Markets and Technology:
Small-scale entrepreneurship through watershed development plays a significant role in poor people’s lives and is one of the keys to lifting people out of poverty. Some of the activities are the backbone on which the rural society survives in most arid and semi-arid regions. Watershed development primarily aiming sustainable management of natural resources contributing for overall agriculture development and livelihood promotion in rural areas. Initial poverty eradication efforts in India concentrated on supply of agricultural technologies, inputs and services that were often ‘production’ oriented. However, they were mostly captured by the wealthy. Later, the approach changed towards ‘capacity -building’ in sector organizations to equip people and organizations with the skills and resources to do a better job. The concept of livelihoods and livelihoods analysis emerged in the mid nineties-closely associated with poverty reduction strategies. This approach was useful to identify and prioritize the needs of the community in enhancing their livelihoods.
Market Structure:
Although micro-enterprises operate in very informal, unregulated environments, the fortunes of most of these activities are connected by supply chains through production channels and the influence of competition, to mainstream commercial markets. These interrelationship increasingly link allied enterprise activities performance to the behavior of other actors in economic networks. Most times production activities of allied enterprises are supported by local markets to fulfill local demand. However, monopoly does not arise as diverse actors are involved in the production processes. Thus, most often, micro-enterprise activity serves as a strong social capital, within the community, builds strong social network.
The Role of Technological Change:
In a world influenced by rapid technological developments, the capacity to cope with, generate and manage change seems like key factors in determining the livelihood strategies of poor people involved in agriculture allied enterprise. In the livelihood analysis, technology assumes greater significance as having at least four interrelated constituents viz. technique (machines and equipment) , knowledge (know-how and skills), organizations (system, procedures ,practices and support structures) , and product (design , specification) (Scott, 1996; Pauli,1999)
Agriculture and allied enterprise activities enhance rural livelihood system through locally available technological backstop. In principle, poor people stand to gain from technological change – generating easier access to information, higher productivity, lower inputs costs, less wastage and better environmental management. However , the pace and volatility of change can be a problem , particular when allied activities are left behind the agriculture development or forced to take greater risks in order to keep pace with increasing vulnerability . As a result, the livelihood determined by these activities capacity to generate and manage technological change. In the long run, an effective analysis of the factors that influence technological change in and around agriculture and allied enterprises is important for understanding the livelihood strategies and options for poor who work in these activities.
An approach in understanding the livelihood opportunities is presented in Figure 1. This approach explicitly link watershed development with rural livelihoods and effectively poverty alleviation. Rural livelihood system is dependent on input and output chains which are cantered on utilization of natural resources. The input chain is mainly providing support to achieve higher growth and larger income flows to different category of people who are depending on these activities. These are the keys to value addition to their income activities that are dependent on market and technology.
For example, village seed bank, vercomposting, nursery raising and bio-fertilizer enterprises are providing enough opportunity to the value addition in the household economy. The allied agricultural activities are gaining importance as the proportion of income coming from agriculture fell and households became increasingly dependent on other sources of income.
The watershed development provides better training and development to farming communities in micro –enterprises forms a better way to reduce migration to urban areas for seeking employment during off-farm season. Selection of micro-enterprises can be based on the locally available resources and technical backstopping for training the farmers. The selection of micro-enterprises can also help women and landless people to promote their livelihoods and to improve the economic condition by using locally available resources. Several micro-enterprises activities provide an opportunity to diversify their livelihood activities and to improve the crop productivity by increasing soil fertility through ecological methods of farming (Wani 2002). These activities avail market facilities at the nearest places to sell their products. Hence, agriculture and allied activities provide greater opportunity to strengthen rural livelihoods.
Income –Generating Micro –Enterprises:
The innovative farmer participatory approach for integrated watershed management implemented through a consortium of research organizations, development.
Medicinal & Aromatic plant Extracts: Medicinal & aromatic plants possess the ability to grow in poor soils and under low rainfall and moisture conditions, thereby assisting in the natural regeneration of these crops. These crops improve specialized skills; encourage contacts with niche markets; adds to crop diversification; and provides employment opportunities (Rangarao , 2009). Value addition to medicinal & aromatic plants product is one of the objectives of crop diversification. Processing of aromatic plants by extraction of oil is value addition to lemongrass, palmarosa, vetiver, and Eucalyptus citriodora (Reddy).
Agriculture:
The harvesting of honey from the forest has been in practice since long and huge profits from this enterprise promoted rearing bees in the farms. In the recent past rural communities while diversifying their agricultural practices, have adopted this practice gradually. Production of honey from farmlands can be a secondary activity for farmers as it requires less time as compared with other activities and can be carried out by women in a house. On an estimate, about 80 percent of honey is used directly in medicines and 10 percent is used in Ayurvedic and pharmaceutical production (Gol, 2006). Studies found that apiculture is an excellent, esthetic livelihood generating endangered hobby. It has a potential market with environmental responsibility and worldwide medicinal and nutritional recognition. Apiculture requires less investment and easy-to-learn (Rangarao, 2009).It also helps in pollination of crops and increase seed setting in many crops.
Upgrading and Rearing Livestock:
Watershed program is an important intervention in dryland areas to improve crop as well as livestock productivity. Small ruminants like, sheep or goats are the best source of regular cash income throughout the year for rural poor without much investment. They form a major component in a tree-crop-livestock diversification /integration paradigm. As integrated crop-dairy farming system is a viable and profitable proposition to the farmers, upgrading livestock is essential.
Village seed bank:
Village seed bank system introduced as part of income –generating activities in many watersheds. These seed banks are providing self-sufficiency and self-reliant for farming communities since they experience the drudgery of seed companies in terms of spurious seeds supply . Therefore, seed banks emerged as a worthy social capital in rural areas.
Vermi-culture:
Vermiculture became a prominent micro-enterprise for rural landless and women groups, as it requires low investment. Vermiculture is environment friendly as it converts disposal of organic wastes generated in farms as well as in household front as productive plant nutrient. These residues contain valuable plant nutrient and can be effectively used for increasing the agricultural productivity. Earthworms convert the residues into valuable source of plant nutrients by feeding on the organic material and excreting out valuable organic manure. Earthworms are one of the major soil macro-invertebrates. The role of earthworms in the soil is to improve soil fertility and soil health. Vermicompost increases water –holding capacity of the soil, promotes crop growth, helps produce more, and improves food and foder quality.
Dal Making:
Dal making is a best micro-enterprise to avoid middlemen and maximum market price for the product. Dal –making is also a value addition to the product through which farmers can benefit the most. This micro-enterprise is brings women self-help groups together and builds strong social network among rural communities. Apart from value addition to the product, farmers also get nutrient-rich fodder to feed animal (ICRISAT, 2004).
Poultry-Based Activities:
Agro wastes (eg. From maize cultivation) can be diverted for poultry feed along with other supplemental food. Rearing of improved breed like boilers can increase the returns and improve the livelihood options.
Horticulture and Forestry –Based Activities:
Teak planting, pomegranate and custard apple cultivation along the bunds and marginal lands will provide profit to the farmers.
Nursery Rising:
Nursery rising forms a means of livelihood for large number of people (Figure 8). Nursery rising as the means for developing livelihood and income generating opportunities for the local communities. It also provides capacity building and skills upgrading for members of the communities. Nursery rising generates cash income, means for poverty alleviation, opportunity for women and aged people to contribute to income generation and flexible working hours.
Village Seed Banks: An Initiative for Self-Reliance and Self-Sufficiency:
With the advent of hybrid technology, the farmers are required to replenish seeds every season from external sources to harness productivity. However, due to increased demand for seeds, it is difficult for varieties cultivated. Thus, unscrupulous elements in the seed industry are active in supplying spurious seeds to farmers causing heavy losses to the farmers and the economy.
Therefore, many attempts are on to practice village seed bank to meet self-sufficiency in production and distribution of quality seeds for the crops where improved cultivars are high yielding and stress tolerant. Watershed development through collective community participation enables the community to revive the age-old concept of self-sufficiency through developing village seed bank. There are successful community initiatives across watershed development programs.
Table-1:Employment Generation and Investment in Micro Enterprises.
(in no)
|
Name of the Enterprises |
Male |
Female |
Total Employment |
Average Employment |
Total Investment (Rs) |
Average Investment (Rs) |
|
Medicinal and Aromatic Plant . |
21 |
3 |
24 |
4 |
150000 |
30,000 |
|
Apiculture |
8 |
10 |
18 |
6 |
2,30,000 |
76,667 |
|
Upgrading and rearing livestock |
5 |
15 |
20 |
5 |
4,70,000 |
1,56,667 |
|
Village seed bank |
12 |
9 |
21 |
3 |
7,05,000 |
1,76,250 |
|
Vermiculture |
20 |
18 |
38 |
6 |
1,29,000 |
43,000 |
|
Poultry Based |
30 |
10 |
40 |
10 |
1,37,000 |
68,500 |
|
Horticulture |
28 |
11 |
39 |
7 |
75600 |
42000 |
|
Nursery Rising |
22 |
15 |
37 |
5 |
100000 |
38000 |
Source: Record of R.D,Department,Tripura Government.
Table-2: Distribution of Labors ( in no)
|
Name of the Enterprises |
Male |
Female |
|
Medicinal and Aromatic Plant |
18 |
6 |
|
Apiculture |
12 |
6 |
|
Upgrading and rearing livestock |
8 |
13 |
|
Village seed bank |
15 |
5 |
|
Vermiculture |
12 |
12 |
|
Poultry Based |
20 |
5 |
|
Nursery Rising |
12 |
4 |
Source: Record of R.D,Department,Tripura Government.
Table-3: Average Income and Return on Investment
|
Name of the enterprises |
Total Income (In Rs.) |
Total Investment(in Rupees) |
|
Medicinal and Aromatic Plant |
89000 |
15000 |
|
Apiculture |
92000 |
16000 |
|
Upgrading and rearing livestock |
50000 |
10000 |
|
Village seed bank |
169000 |
70000 |
|
Vermiculture |
200000 |
55000 |
|
Poultry Based |
300000 |
100000 |
|
Nursery Rising |
100000 |
350000 |
Source: Record of R.D,Department,Tripura Government.
Conclusion:
Agriculture, natural resources and micro-enterprises are interrelated. It is therefore, important. It is therefore, important to able to understand exactly what is likely to occur in particular contexts. Given the increased witness on the role of micro enterprise in promoting rural livelihoods and the associated increase in the proportion of household income derived from these activities, this merits some serious study, a need that has also been emphasized by researcher (Dixit. 2005, Rangarao 2009). In this context, attention needs to be paid to the broader context in which changes are taking place. The economy is going through a transition in which agriculture and the industry are changing rapidly in response to globalization, environmental limits, stresses and population pressure.
Agriculture allied enterprises should be viewed as an alternative main stream non-farm employment opportunities and although not the perfect way of providing employment to the poor. Therefore, there is an urgent need to understand how watershed development can become a part of efforts to support most diverse livelihood portfolios where a win-win situation can be created through improving the resource base which creates a more conducive environment for undertaking micro-enterprise activities, leading to an overall increase in standard of living, employment, poverty reduction and building resilience of community to cope with the impacts of drought.
References:
1. Dixit Sreenath, Wani S.P, Ravinder Reddy Ch, Roy Somnath, Reddy BVS, Sreedevi TK, Ramakrishna A (2005), “Global Theme on Agro-Ecosystems Report” No. 17.
2. GOI (2006)” National Bio-Resource Development Board of DBT”, Ministry of Science and Technology. No.20
3. ICRISAT (2004), “Improved Livelihood Opportunities through Watersheds”.
No.38
Women Empowerment and the Constitution of India
Dr. Shimla,
Consultant,
Bureau of Parliamentary Studies & Training
Lok Sabha Secretariat, New Delhi
Abstract: The constitution has provided all kinds of opportunities for women empowerment and their safeguard. It is the societal attitude and feudal mindset which had been hampering the women empowerment. But now the brave Indian women have started coming up fully prepared to claim their rights and contributing to nation building. Women empowerment is essential for the social and economic development of any country. They are in the fore front in every field. They have the talent, they are competent and intelligent, they are hard working, they are focused, they are resilient. With equal rights and opportunities opened to them, they can and they are participating fully in economic life across all sectors.
Key Words: Constitution, Women, participating and Economic.
Introduction: Dictionary meaning of empower is ‘to enable’ or to authorize power to somebody, to empower also refers to enable someone realize their full potential. In the context of women empowerment may be construed to creating an environment where they can make choices, and can make decisions in their personal, familial and social life. Financial strength is a major source of empowerment, and for claiming their rights.
There are two aspects of this concept. One is to make a woman capable of taking decisions and working to realize their goals. It involves the mental capabilities, to make choice between right and wrong, between which one is more beneficial or less harmful, between what is the right course to reach to a goal or a solution to any problem and how far it is achievable. Making such choices involves the mental capabilities, knowledge analytical abilities, self confidence, discernability and sense of responsibility. All these attributes are acquired through education and exposure. Hence education is the most powerful means of empowerment of any human being.
Another aspect of empowerment is the availability of opportunities. After all what is decision making? It is about making a choice out of available/created options. This is done through opening up of avenues for women, removing social barriers, facilitating financial support and providing proper legal safeguards.
Women in India were kept at a very high pedestal in ancient Indian culture. She is the symbol of Shakti, prosperity and culture and education. But this country was subjugated for centuries and through that period decadence crept in and griped the society which degraded the position of women in law and the society. They were denied both, the development of their mental faculty through education and equal opportunity, and the rights in the society.
As no Yajna is complete without the participation of women in Indian culture. The struggle for India’s freedom was a great Yajna in which very many able women participated shoulder to shoulder with men. In fact from the very start of our national awakening, the enlightened men who were leading the struggle against a foreign subjugation had realized that no country can prosper if half of the population remained subjugated. They encouraged women to come forward as equal partners in the struggle for freedom and to do service for national regeneration in different walks of life. It was Mahatma Gandhi who gave a call to the women of this country to take part in the national movement and with this call of his all the barriers of centuries broke down.
Making of India’s Constitution
The women in other parts of the world had to wage a long and arduous struggle to gain the equal rights. But the founding fathers of our constitution had imbibed liberal political thinking and democratic principles of liberty, equality and justice of the west. Many of them studied the western political thinkers, in English Universities and had direct exposure to the working of democratic institutions in the western world. The great political thinker, J.S. Mills provided the first framework of modern democratic equality by extending the logic of the defense of liberty to end the subjugation of women. He propagated four social benefits of women’s equality. (1) It will remove despotism from the family which will help in creating democratic citizenship, (2) It will lead to doubling the mass of mental faculties available to the society and better performance of men because of competition with female colleagues, (3) Women enjoying equality will have better influence on mankind, (4) With equal rights their happiness will increase many folds and this will satisfy the utilitarian principle of greatest happiness of greatest number.
Besides, through the long drawn struggle for freedom, many of the ideals for the future constitution had taken shape in numerous Congress sessions. The leaders of our freedom struggle had started conceptualizing these ideals as early as the Home League Rule movement by Annie Besant. They had realized that without equal rights for women the democratic project was incomplete. The famous resolution drafted by Jawahar Lal Nehru and adopted at Karachi session in 1931 also included the Fundamental Rights for all citizens. The Nehru Report which may be called the first attempt of framing the Constitution of India, envisaged “men and women shall have equal rights”. The draft constitution of Dr. K.M. Munshi specifically mentions “Women citizens are the equal of Men citizens in all the spheres of political, economic, social and cultural life and are entitled to the same civil rights and are subject to the same duties unless where exception is made by the law of Union on account of sex”.
The women of India were represented in the Constituent Assembly for framing a Constitution of India by able and eminent women like Raj Kumari Amrit Kaur, Hansa Mehta, Renuka Roy, Dakshyani Velayudan, G. Durga Bai, Purnima Banerji, Sarojini Naidu, Sucheta Kripalani, Malati Chaudhary, Anne Masscareve Leela Roy, Ammu Swaminathan, Begam Aizaz Rasul. All these women were highly educated and enlightened. They had minds of their own and also their own views on very crucial issues. Some of them served on the most important Committees of Constituent Assembly like Advisory Committee on Fundamental Rights of citizens and Minority Rights, Sub-Committee on Fundamental Rights, Sub-Committee on Minority Rights and Provincial Constitution Committee. They immensely contributed to the making of Constitution of India especially to the fundamental rights. They served on these committees with utmost sincerity and put forward their views on the crucial issues in an honest and candid fashion. To cite few examples –
The Minority Rights Committee on which there were two women members, received many representations from various interests for reservation of minorities in legislation; joint vs. separate electorates, reservation of seats for minorities in cabinets, in public services and administrative machinery. It was imperialist legacy of fragmenting the country segregating the minorities on the basis of percentage.
It was Raj Kumari Amrit Kaur, herself a christen whose representation reflected the national point of view. She opposed both, the reservation of seats and weightage for any community, anything in the nature of privileges for any special class or section she stated was wrong in principle and when it was given on the ground of religion doubly wrong and was against the declared object of the Indian Union. ( K.M. Munshi; “Pilgrimage to Freedom Vol. I Page 200”)
Look at the vision of these courageous women who spoke their mind so fearlessly on such a sensitive issue. They were the framers of constitution of India who could speak for unity of India and equal rights for all.
During the discussion on Fundamental Rights Committee”s Report in Constituent Assembly Mrs. Purnima Banjerji, expressed her views on what kind of religious education may be allowed to be imparted through her amendment as “All religious education given in educational institutions receiving state aid will be in the nature of the elementary philosophy of comparative religions, calculated to broaden the pupils mind than such as will foster sectarian exclusiveness”.
Mrs. Renuka Roy rejected the reservation for women while speaking on the Report on the Principles of a Model Provincial Constitution”.
What is clear from the above cited examples is that these were the women with clarity of thoughts, broad vision and courage to say what they thought to be good for the nation. These qualities are rare.
The Constitution and Empowerment of Women
The Constitution which emerged from the Constituent Assembly and adopted by the people of India through the Preamble has not only provided for equal rights, opportunities and safeguards for women to empower them socially, economically and politically, but also has made special provision for their upliftment.
The Preamble to the Constitution proclaims “to secure to all its citizens justice, social, economic and political and equality of status and of opportunity”.
Fundamental rights as enshrined in the Constitution, provide for equal rights irrespective of caste, religion or sex.
Article 14 – Right to Equality, provides – “the state shall not deny to any person equality before the law or the equal protection of the law............”
Article 15 – Prohibits any discrimination on the grounds of religion, race, caste, sex, ........”
Article 15 (3) empowers the state for making special provisions for women .
Article 16 provides for equality of opportunity in matters of public employment or appointment to any office under state.
Other than these rights, constitution also enjoins upon every citizen to renounce practices derogatory to the dignity of women (Article 51-A).
Article 14 requires all citizens subjected to any legislation should be treated alike under like circumstances and conditions. Equals have to be treated equally and unequals ought not to be treated equally, because women did not have adequate political representation that is why provision of one-third seats for women in Panchayats has been made through 73rd and 74th constitution amendment. This was a historic amendment which has changed the face of local bodies in favour of women. It has brought a drastic improvement in political empowerment of women. The representation of women up to 33.33% in these institutions has resulted in the entry of a large number of women in the decision making representative bodies at local level.
As per the provisions of the Directive Principles of State Policy, the National Commission for Women was set up in 1992 as a statutory body, which is working for women empowerment and providing them safeguards. The Committee of both the Houses of Parliament for Women Empowerment has also been working since 1987.
Working of constitution for over half a century has proved the efficacy of our system. Women have come to occupy the most powerful positions like that of President of India, Speaker of Lok Sabha and State Legislatures. Prime Minister, Chief Ministers of States and Cabinet Ministers. The current Lok Sabha (16th) has up to 11.65% (65 women members) representation of women. There are 7 women Ministers in the Union Council of Ministers. These representations seems to be the highest so far. The affirmative action as that under 73rd & 74th constitution amendment at the level of state and central legislature by passing the Women Reservation Bill can ensure adequate representation of women in the highest policy making bodies.
Conclusion: The constitution has provided all kinds of opportunities for women empowerment and their safeguard. It is the societal attitude and feudal mindset which had been hampering the women empowerment. But now the brave Indian women have started coming up fully prepared to claim their rights and contributing to nation building. Women empowerment is essential for the social and economic development of any country. They are in the fore front in every field. They have the talent, they are competent and intelligent, they are hard working, they are focused, they are resilient. With equal rights and opportunities opened to them, they can and they are participating fully in economic life across all sectors.
References:
(1) K.M. Munshi – Pilgrimage to Freedom, Bharatiya Vidya Bhawan
(2) Constituent Assembly Debates – Lok Sabha Secretariat
(3) Constitution of India
Author: Dr. Shimla,
Consultant,
Bureau of Parliamentary Studies and Training
Lok Sabha Secretariat
New Delhi.
Formerly: Registrar, BPS Mahila University, Sonipat,
YMCA University of Science & Technology, Faridabad
Director at Lok Sabha Secretariat
Employment Diversification by Female Compared to Male workers: Some Quantitative and Qualitative Aspects
Dr. Chitrita Bhowmick
Assistant Professor, Department of Economics
Victoria Institution (College), University of Calcutta
And
Samprit Chakrabarti
Faculty Member, IBS, Kolkata
Abstract: The development status of an economy is determined by the sectoral participation of workers and the related earnings there from. Employment strategy also depends on this development status. Presence of significant percentage of unemployment particularly in the rural areas demands much attention on rural employment generation.
In the context of India, diversification in rural employment has gained significant importance over time which has been studied by several researchers over the past two decades. The studies based on the analysis of secondary data reveal that the excessive dependence on agriculture as a source of livelihood show a steady decline and the rural economy has witnessed a modest degree of diversification. The significance of non-farm employment as an instrument of rural poverty alleviation is highly regarded in policy thinking. However, the emergence and the growth of the non-farm sector vary across places and its impact on poverty alleviation is also mixed.Our particular emphasis is on West Bengal. Rural West Bengal is witnessing diversification in economic activity in favour of non-farm activities and the pattern of rural employment has been quite different from the all India picture (see C.P.Chandrasekhar, 1993). In West Bengal, the average level of rural non-farm employment is much higher at comparable dates and the participation of female in non-farm activities also high, though rural female participation rates in general are much lower. However, the presence of significant percentage of rural people below the poverty line (28% in 2004-05) makes not only the employment generation but also the analysis of the qualitative aspects of employment the most pressing concern. Accordingly, present paper try to analyses i) the trend, pattern and participation of female workers compare to male in non-farm sector at all India level with a particular emphasis on West Bengal ii) Qualitative aspect of employment. The analysis of quantitative and qualitative aspects of employment will provide some additional insight on the trends and pattern of female employment in India vis-à-vis West Bengal.
Key Words: Development, Status ,Economy and Participation
1.1.Introduction:
The development status of an economy is determined by the sectoral participation of workers and the related earnings there from. Employment strategy also depends on this development status. Presence of significant percentage of unemployment particularly in the rural areas demands much attention on rural employment generation.
In the context of India, diversification in rural employment has gained significant importance over time which has been studied by several researchers over the past two decades. The studies based on the analysis of secondary data reveal that the excessive dependence on agriculture as a source of livelihood show a steady decline and the rural economy has witnessed a modest degree of diversification. The significance of non-farm employment as an instrument of rural poverty alleviation is highly regarded in policy thinking. However, the emergence and the growth of the non-farm sector vary across places and its impact on poverty alleviation is also mixed.Our particular emphasis is on West Bengal. Rural West Bengal is witnessing diversification in economic activity in favour of non-farm activities and the pattern of rural employment has been quite different from the all India picture (see C.P.Chandrasekhar, 1993). In West Bengal, the average level of rural non-farm employment is much higher at comparable dates and the participation of female in non-farm activities also high, though rural female participation rates in general are much lower. However, the presence of significant percentage of rural people below the poverty line (28% in 2004-05) makes not only the employment generation but also the analysis of the qualitative aspects of employment the most pressing concern.The analysis of quantitative and qualitative aspects of employment will provide some additional insight on the trends and pattern of female employment in India vis-à-vis West Bengal.
This paper is solely devoted to the analysis of secondary data. The quinquennial National Sample Surveys on employment and unemployment and the decennial population Census are the two major sources of data to study changes in the employment structure. The present study based on NSSO data to analyse employment trend at all India level with a particular emphasis on West Bengal.
Accordingly, the paper consists of seven sections. In section 1.2 we analyze the incidence and size of rural non-farm employment in India. Sectoral composition of workers for India is presented in section 1.3. Growth of employment across the sectors is presented in section 1.4 of this paper. Some qualitative aspects of employment are analyzed in section 1.5. Section 1.6 analyses the incidence and growth of non-farm employment in West Bengal and section 1.7 provides summary of findings and concluding observations.
1.2. Incidence and size of rural non-farm employment
Proposition-I: The percentage share of Rural Non-farm employment is increasing during the period 1993-94 to 2009-10, in India:
Table-1a is based on NSSO estimates, gives the incidence of rural non-farm employment in all India during the period 1993-94 to 2009-10.It is clear from Table-1a that the incidence of rural non-farm employment (US-PS+SS basis, person) on all-India basis, increased gradually between the periods 1993-94 to 2009-10.It increased from 21.6 percent in 1993-94 to 32.0 percent in 2009-10.
If we look at the incidence of rural non-farm employment (US-PS+SS basis) in all India separately for males and females, it can be clearly observed that the increase has been more pronounced in the case of male workers. It increased from 25.9 percent in 1993-94 to 37.2 percent in 2009-10 for male workers and from 13.9 percent in 1993-94 to 20.7 percent in 2009-10 for females.
Proposition-II: The absolute number of rural Non-farm workers has increased during the period 1993-94 to 2009-10:
The expansion of non-farm employment in rural India could also visualize from the absolute figures of non-farm employment in different points of time. The absolute size of non-farm employment has been increasing continuously since 1993-94 (see Table-1a). As shown in Table-1b, at the all India level, the number of rural non-farm employment increased by 2.91 million persons per year during 2004-05 and 2009-10 as against 1.24 million persons per year during 1993-94 and 1999-00.
However, if we look at the incidence of rural non-farm employment separately for males and females, it emerges that increased has been more pronounced in case of male workers all through the period of 1993-94 to 2009-10.Table-1b shows that the non-farm employment increased by 2.59 million per year for the males during the period 2004-05 and 2009-10 as against only 0.19 million per year for the females.
Table - 1a: Percentage of Rural Non-Farm workers to total workers in All-India US-PS+SS basis
|
NSS Round |
Year |
Size of Non-Farm Employment(in million) |
US-PS+SS basis |
||||
|
Male |
Female |
Person |
Male |
Female |
Person |
||
|
50th |
July1993-June’94 |
48.66 |
14.67 |
63.22 |
25.9 |
13.9 |
21.6 |
|
55th |
July1999-June’00 |
55.96 |
15.25 |
70.65 |
28.7 |
14.8 |
23.8 |
|
61st |
July2004-June’05 |
73.31 |
20.70 |
93.47 |
33.5 |
16.8 |
27.3 |
|
66th |
July2009-June’10 |
86.25 |
21.66 |
108.01 |
37.2 |
20.7 |
32.0 |
Source: Estimates based on ‘Employment and Unemployment Survey’ of NSSO during 1993-94, 1999-00, 2004-05 and 2009-10.
Chart - 1: Percentage of Rural Non-Farm workers to total workers in All-India US-PS+SS basis
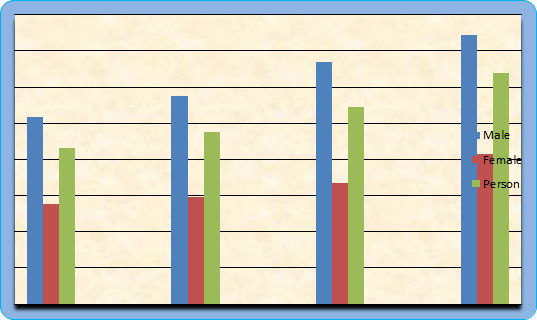
Source-Table-1a
Table – 1b: Average yearly change of Rural No-farm Employment in All-India (US-PS+SS Basis)
|
Average yearly change(in million) |
Male |
Female |
Person |
|
1993-94 and 1999-00 |
1.22 |
0.10 |
1.24 |
|
1999-00 and 2004-05 |
3.47 |
1.09 |
4.56 |
|
2004-05 and 2009-10 |
2.59 |
0.19 |
2.91 |
Source: Estimates based on ‘Employment and Unemployment Survey’ of NSSO during 1993-94, 1999-00, 2004-05 and 2009-10.
Proposition-III: The percentage share of Rural Non-farm Employment by US-PS basis has increased during the period 1993-94 to 2009-10:
An alternative way to measure the incidence of employment is Usual Principal Status (US-PS).It is the activity status on which a person spent relatively longer time during a year preceding the date of survey. On US-PS basis, the incidence of non-farm employment also shows a steady increase from 22.9 percent in 1993-94 to 33.2 percent in 2009-10.
Table-1c: Percentage of Rural Non-Farm workers to total workers in All-India US-PS basis
|
Sex of workers |
1993-94 |
1999-00 |
2004-05 |
2009-10 |
|
Male |
26.0 |
28.7 |
33.8 |
37.5 |
|
Female |
15.4 |
16.0 |
18.6 |
21.1 |
|
Person |
22.9 |
25.0 |
29.2 |
33.2 |
Source: Estimates based on ‘Employment and Unemployment Survey’ of NSSO during 1993-94, 1999-00, 2004-05 and 2009-10.
Chart - 2: Percentage of Rural Non-Farm workers to total workers in All-India US-PS basis
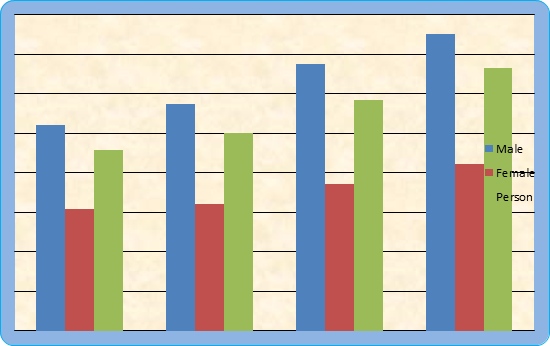
Source: Table-1c
Table-1b, 1c and Chart-2 show an increasing trend of participation of rural workers in non-farm sectors although the intensity of participation is different for rural males and females. However, our present study mainly based on US (PS+SS)basis for analyzing sectoral composition and growth of non-farm employment during the reference period.
1.3. Sectoral Composition of rural non-farm workers
Table-2 based on usual status (US-PS+SS basis) NSS estimates, gives the sectoral distribution of rural (and urban) workers for the years 1993-94 to 2009-10.The contrast is between what has happening to rural workers, in general, and to rural female workers, in particular, during the period 1993-94 to 2009-10. This will help in identifying the major sub-sectors within the rural non-farm sector that are relatively more important from the point of view of generating non-farm employment.
Here, the contrast is between a) primary sector with the secondary and tertiary sectors i.e. between the farm and the non-farm sector, b) mobility of workers from farm sector to different non-farm activities.
Main observations from the secondary data analysis are as follow:
i) In rural India the proportion of rural workers engaged in primary sector has been declining from 78.4 percent in 1993-94 to 68.0 percent in 2009-10. The proportion of their employment in the secondary and tertiary sector and in total non-farm sector has witnessed a steady increase (see Table-2).
ii) Now we consider the sectoral composition of workers for male and female workers separately. The proportion of male workers engaged in the primary sector steadily decline from 74.1 percent in 1993-94 to 62.8 percent in 2009-10.
On the other hand, the proportion of their employment in the secondary, tertiary and in total non-farm sector has witnessed a steady increase, from 25.9 percent in 1993-94 to 37.2 percent in 2009-10 (see Table-2).
It is clearly visible that their excessive dependence on agriculture, as a source of livelihood, has continuously moving downwards along with their employment base witnessing a modest degree of diversification. This may due to the fact that the uncertainty and volatility in the agricultural employment and hence their earnings from agriculture (particularly for agricultural labour) was not sufficient to provide the means of survival. Therefore, workers diversify to obtain some alternative source of employment for their livelihood. In particular, their base of non-farm employment has expanded from 25.9 percent in 1999-00 to 37.2 percent in 2009-10.
iii) For the rural female workers, their dependence on the primary sector employment too witnessed a steady decline from 86.2 percent in 1993-94 to 79.30 percent in 2009-10. However, the proportion of these workers engaged in the primary sector remained more or less constant at nearly 80 percent. Their employment in the secondary sector witnessed a steady increase from 8.3 percent in 1993-94 to 13.0 percent in 2009-10. Finally, not more than 6 to 8 percent of them were employed in tertiary sector. Not more than 21 percent of them could get absorbed in the network of non-farm activities.
iv) In all India, as regards male non-farm employment, the most important sector has been construction, which is followed (in descending order of percentage share in total non-farm employment) by trade (wholesale and retail), manufacturing, community-social and personal services and transport etc. These five sectors together accounted for 94 percent of total rural non-farm workers among the males in 2009-10 (see Table-3). In case of females, the manufacturing sector alone accounted for more than half of total non-farm worker till 2004-05. However for females, the percentage share of manufacturing in total non-farm employment shows a sharp decline from 50.30 percent to 36.06 percent and the sector that gains in the process is the construction sector. The percentage share of construction sector in total non-farm employment for females is 25 percent in 2009-10. The other major non-farm employment generating sectors have been services and trade. These four sectors together accounted for nearly 96 percent of total non-farm workers among females (see Table-3). Therefore for the rural workers as a whole, the most important sector has been construction followed by manufacturing, trade, hotel and restaurant, community and social services, transport, storage etc. These five sectors together accounted for 95 percent of total rural non-farm workers in 2009-10.
v) At the all India level, manufacturing and service sectors in the case of males tend to loose their shares in total rural non-farm employment over the years while the sectors gain in the process are construction and transport. The share of trade increases up to 2004-05 for males but it shows a sharp decline from 24.77 percent in 2004-05 to 21.75 percent in 2009-10. As regards females, manufacturing looses its share in total rural non-farm employment over the years and the sector that shows increasing share in total rural non-farm employment for females are construction, community, social and personal services and trade (Table-3).
Table - 2: Sectoral Distribution of Usual Status (US-PS+SS) workers in India by workers’ sex and residence: 1993-94 to 2009-10(%)
|
|
1993-94 |
1999-00 |
2004-05 |
2009-10 |
|
|
Agriculture |
|||||
|
Rural Males |
74.1 |
71.4 |
66.5 |
62.8 |
|
|
Rural Females |
86.2 |
85.4 |
83.3 |
79.3 |
|
|
Rural Person |
78.4 |
76.3 |
72.7 |
67.9 |
|
|
Urban Males |
9.00 |
6.6 |
6.1 |
6.0 |
|
|
Urban Females |
24.7 |
17.7 |
18.1 |
13.9 |
|
|
Urban Person |
12.4 |
8.8 |
8.3 |
7.5 |
|
|
Mining Quarrying |
|||||
|
Rural Males |
0.7 |
0.6 |
0.6 |
0.8 |
|
|
Rural Females |
0.4 |
0.3 |
0.3 |
0.3 |
|
|
Rural Person |
0.6 |
0.5 |
0.5 |
0.6 |
|
|
Urban Males |
1.3 |
0.9 |
0.9 |
0.7 |
|
|
Urban Females |
0.6 |
0.4 |
0.2 |
0.3 |
|
|
Urban Person |
1.2 |
0.8 |
0.8 |
0.6 |
|
|
Manufacturing |
|||||
|
Rural Males |
7.0 |
7.3 |
7.9 |
7.0 |
|
|
Rural Females |
7.0 |
7.6 |
8.4 |
7.5 |
|
|
Rural Person |
7.0 |
7.4 |
8.1 |
7.2 |
|
|
Urban Males |
23.5 |
22.4 |
23.5 |
21.8 |
|
|
Urban Females |
24.1 |
24.0 |
28.2 |
27.9 |
|
|
Urban Person |
23.6 |
22.7 |
24.6 |
23.0 |
|
|
Utilities |
|||||
|
Rural Males |
0.3 |
0.2 |
0.2 |
0.2 |
|
|
Rural Females |
0.1 |
- |
- |
0.0 |
|
|
Rural Person |
0.2 |
0.2 |
0.2 |
0.2 |
|
|
Urban Males |
1.2 |
0.8 |
0.8 |
0.7 |
|
|
Urban Females |
0.3 |
0.2 |
0.2 |
0.4 |
|
|
Urban Person |
1.0 |
0.7 |
0.7 |
0.6 |
|
|
Construction |
|||||
|
Rural Males |
3.2 |
4.5 |
6.8 |
11.3 |
|
|
Rural Females |
0.9 |
1.1 |
1.5 |
5.2 |
|
|
Rural Person |
2.4 |
3.3 |
4.9 |
17.4 |
|
|
Urban Males |
6.9 |
8.7 |
9.2 |
11.4 |
|
|
Urban Females |
4.1 |
4.8 |
3.8 |
4.7 |
|
|
Urban Person |
6.3 |
8.0 |
8.0 |
10.2 |
|
|
Secondary Sector |
|||||
|
Rural Males |
11.2 |
12.6 |
15.5 |
19.3 |
|
|
Rural Females |
8.4 |
9.0 |
10.2 |
13.0 |
|
|
Rural Person |
10.2 |
11.4 |
13.6 |
17.4 |
|
|
Urban Males |
32.9 |
32.8 |
34.4 |
34.7 |
|
|
Urban Females |
29.1 |
29.4 |
32.4 |
33.2 |
|
|
Urban Person |
32.1 |
32.2 |
34.0 |
34.4 |
|
|
Trade, hotel and restaurant |
|||||
|
Rural Males |
5.5 |
6.8 |
8.3 |
8.2 |
|
|
Rural Females |
2.1 |
2.0 |
2.5 |
2.8 |
|
|
Rural Person |
4.3 |
5.1 |
6.1 |
6.4 |
|
|
Urban Males |
21.9 |
29.4 |
28.0 |
27.0 |
|
|
Urban Females |
10.0 |
16.9 |
12.2 |
12.1 |
|
|
Urban Person |
19.4 |
26.9 |
24.6 |
24.3 |
|
|
Transport, storage and communication |
|||||
|
Rural Males |
2.2 |
3.2 |
3.8 |
4.1 |
|
|
Rural Females |
0.1 |
0.1 |
0.2 |
0.2 |
|
|
Rural Person |
1.4 |
2.1 |
2.5 |
2.9 |
|
|
Urban Males |
9.7 |
10.4 |
10.7 |
10.4 |
|
|
Urban Females |
1.3 |
1.8 |
1.4 |
1.4 |
|
|
Urban Person |
7.9 |
8.7 |
8.6 |
8.7 |
|
|
Services |
|||||
|
Rural Males |
7.0 |
6.1 |
5.9 |
5.6 |
|
|
Rural Females |
3.4 |
3.7 |
3.9 |
4.7 |
|
|
Rural Person |
5.7 |
5.2 |
5.1 |
5.4 |
|
|
Urban Males |
26.4 |
21.0 |
20.8 |
21.9 |
|
|
Urban Females |
35.0 |
34.2 |
35.9 |
39.3 |
|
|
Urban Person |
28.2 |
23.5 |
24.0 |
25.2 |
|
|
Tertiary Sector |
|||||
|
Rural Males |
14.7 |
16.1 |
18.0 |
17.9 |
|
|
Rural Females |
5.6 |
5.8 |
6.6 |
7.6 |
|
|
Rural Person |
11.4 |
12.4 |
13.7 |
14.7 |
|
|
Urban Males |
58.0 |
60.8 |
59.5 |
59.3 |
|
|
Urban Females |
46.3 |
52.9 |
49.5 |
52.9 |
|
|
Urban Person |
55.5 |
59.2 |
57.2 |
58.1 |
|
|
All Non-farm Sector |
|||||
|
Rural Males |
25.9 |
28.7 |
33.5 |
37.2 |
|
|
Rural Females |
14.0 |
14.8 |
16.8 |
20.7 |
|
|
Rural Person |
21.6 |
23.8 |
27.3 |
32.1 |
|
|
Urban Males |
90.9 |
93.6 |
93.9 |
94.0 |
|
|
Urban Females |
75.4 |
82.3 |
81.9 |
86.1 |
|
|
Urban Person |
87.6 |
91.4 |
91.7 |
92.5 |
|
Source: Estimates based on ‘Employment and Unemployment Survey’ of NSSO during 1993-94, 1999-00, 2004-05 and 2009-10.
Chart- 3: Percentage Distribution of workers in different Sectors
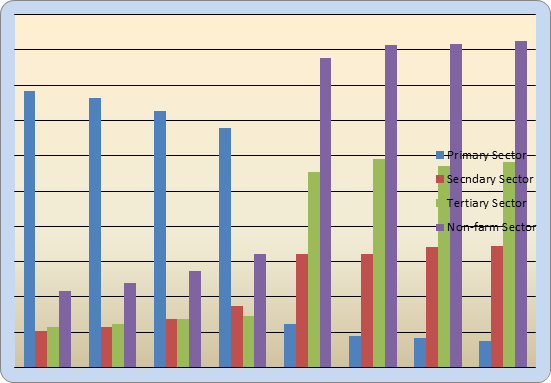
Source: Table-2
|
Sector |
Male |
Female |
Person |
|||||||||
|
1993-94 |
1999-00 |
2004-05 |
2009-10 |
1993-94 |
1999-00 |
2004-05 |
2009-10 |
1993-94 |
1999-00 |
2004-05 |
2009-10 |
|
|
Mining & Quarrying |
2.70 |
2.09 |
1.79 |
2.12 |
2.90 |
2.05 |
1.80 |
1.44 |
2.78 |
2.10 |
1.83 |
1.85 |
|
Manufacturing |
27.03 |
25.52 |
23.58 |
18.57 |
50.72 |
52.05 |
50.30 |
36.06 |
32.41 |
31.09 |
29.67 |
22.22 |
|
Electricity, Gas and Water Supply |
1.58 |
0.70 |
0.60 |
0.53 |
- |
- |
- |
- |
0.93 |
0.84 |
0.73 |
0.62 |
|
Construction |
12.36 |
15.73 |
20.30 |
29.97 |
6.52 |
7.53 |
8.98 |
25.00 |
11.11 |
13.87 |
17.95 |
29.01 |
|
Trade, hotel and restaurant |
21.24 |
23.78 |
24.77 |
21.75 |
15.22 |
13.70 |
14.97 |
13.46 |
19.91 |
21.43 |
22.34 |
19.75 |
|
Transport, storage and communication |
8.49 |
11.89 |
11.34 |
10.88 |
0.72 |
0.68 |
1.20 |
0.96 |
6.48 |
8.82 |
9.16 |
8.95 |
|
Fin+Insu+RE+B.Servi |
1.54 |
1.74 |
2.09 |
1.86 |
0.71 |
0.68 |
0.60 |
0.96 |
1.39 |
1.26 |
1.83 |
1.85 |
|
Comm+Soci+Pers. Ser |
25.48 |
19.51 |
15.22 |
12.73 |
23.57 |
24.32 |
22.75 |
21.15 |
25.00 |
20.59 |
16.85 |
14.81 |
|
All non-farm sector |
100.00 |
100.00 |
100.00 |
100.00 |
100.00 |
100.00 |
100.00 |
100.00 |
100.00 |
100.00 |
100.00 |
100.00 |
Source: Estimates based on ‘Employment and Unemployment Survey’ of NSSO during 1993-94, 1999-00, 2004-05 and 2009-10.
1.4. Growth of Employment and the emerging subsectors
Proposition-I: Employment growth decline during 1993-94 to 2009-10:
Tables -4, 5a and 5b present comparative account of overall employment growth and also its trends for nine major industrial categories. Consider the over all rate of growth of employment during the period 1993-94/1999-00 to 1999-00/2004-05, for rural workers, it increases from 0.23 percent to 2.89 percent ; for rural males, it increases from 0.62 percent to 2.33 percent and for rural females it increases from -0.28 percent to 3.76 percent. A varying degree of increase was witnessed for urban areas also; it increases from 2.81 percent to 3.43 percent for urban males, from 1.44 percent to 5.58 percent for females and from 2.59 percent to 3.72 percent for urban persons (see Table-4). It is important to note that the rate of growth of urban employment, continued to be much higher than that in the rural areas, especially when the rural-urban comparison is made for workers belonging to the same sex. During the period 2004-05/2009-10 the growth rate of both rural and urban workers show a declining trend and it is negative for female workers.
Proposition-II: Emerging sub-sectors that are important in terms of growth of employment during the period 1993-94 to 2009-10:
Now we consider the employment scenario in individual sectors (see Table-5a and Table-5b). Highly disparate trends are discernible for employment growth, during the period 2004-05/2009-10 over 1993-94/1999-00 in various sectors of the economy. For example, for rural workers, construction, transport-storage-communication, finance-insurance-real estate, mining and quarrying are important sector in terms of growth of employment. Employment for rural males in the construction sector increased from 6.51 percent to 11.98 percent but the increased was more pronounced for their female counterparts from 3.11 percent in 1993-94/1999 to 23.95 percent in 2004-05/2009-10. In transport-storage-communication there was a decline in employment growth for rural males and it is negative for rural females. It shows a negative growth in 2009-10.Another feature of employment scenario during the reference period is that, manufacturing sector shows a sharp increase from 1.33 percent during 1993-94/1999-00 to 3.96 percent during 1999-00/2004-05 for rural males and from 1.10 percent to 5.86 percent for rural females in the same period. But for both rural male and female workers it shows a negative growth during 2004-05/2009-10. In case of trade, hotel and restaurant, it shows an increasing trend from 4.24 percent in 1993-94/1999-00 to 6.50 percent in 1999-00/2004-05 but it shows a sharp increase for their female counter parts from -1.09 percent to 8.50 percent in 1999-00/2004-05.However, it is negative for rural females during 2004-05/2009-10. In 1993-94/1999-00, employment growth was negative in mining and quarrying, utilities (consisting of electricity, gas and water supply) and community services. The employment growth rate turns out to be positive for utilities, community-social-personal services for rural males during the period 2004-05/2009-10. For rural workers as a whole non-farm employment growth shows a sharp decline from 5.76 percent in 1999-00/2004-05 to 2.94 percent in 2004-05/2009-10.This is also true for rural male and female workers.
In urban areas, the most important sectors in terms of employment growth for males are construction, manufacturing, transport-storage-communication, finance-insurance-real estate. For urban females the important sectors in terms of employment growth are construction, finance-insurance-real estate. Therefore, for the urban workers as whole important sectors in terms of employment growths are construction, transport-storage-communication and finance-insurance-real estate (during the reference period). The non-agricultural sector as a whole shows a marginal increase from 3.32 percent in 1993-94/1999-00 to 3.68 percent in 1999-00/2004-05. The increase was more pronounced for urban female workers (from 2.93 percent to 5.48 percent) than their male counterparts. During the period 2004-05/2009-10, the overall growth rates of non-farm employment for males and females in urban area (and also for the urban workers as a whole) show a declining trend. The growth rate for urban female workers is negative. Such decline in the growth rate of non-farm employment in urban areas may be due to slowdown in the growth rate of trade-hotel-restaurant, manufacturing and transport-storage-communication sectors.
Table - 4: Annual Compound Growth of Workers (US-PS+SS)
|
|
|
Male |
Female |
Person |
|
Rural |
1993-94/1999-00 |
0.62 |
-0.28 |
0.23 |
|
1999-00/2004-05 |
2.33 |
3.76 |
2.89 |
|
|
2004-05/2009-10 |
1.16 |
-3.33 |
-0.35 |
|
|
Urban |
1993-94/1999-00 |
2.81 |
1.44 |
2.59 |
|
1999-00/2004-05 |
3.43 |
5.58 |
3.72 |
|
|
2004-05/2009-10 |
2.00 |
-1.49 |
1.36 |
|
|
Total |
1993-94/1999-00 |
1.18 |
0.14 |
0.83 |
|
1999-00/2004-05 |
2.66 |
4.03 |
3.06 |
|
|
2004-05/2009-10 |
1.41 |
-3.13 |
0.05 |
Source: Estimates based on ‘Employment and Unemployment Survey’ of NSSO during 1993-94, 1999-00, 2004-05 and 2009-10.
Chart - 4: Annual Compound Growth Rate of Workers during 1993-94, 1999-00, 2004-05 and 2009-10
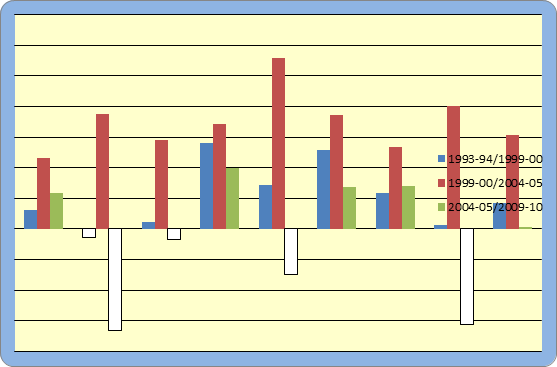
Source: Table-4
|
|
RURAL PERSON |
URBAN PERSON |
RURAL+URBAN Person |
||||||
|
|
1993-94/ 1999-00 |
1999-00/ 2004-05 |
2004-05/ 2009-10 |
1993-94/ 1999-00 |
1999-00/ 2004-05 |
2004-05/ 2009-10 |
1993-94/ 1999-00 |
1999-00/ 2004-05 |
2004-05/ 2009-10 |
|
Agriculture |
-0.22 |
1.90 |
-1.67 |
-2.98 |
3.72 |
-1.83 |
-0.04 |
2.61 |
-1.83 |
|
Mining and Quarrying |
-2.77 |
2.89 |
3.35 |
-4.11 |
3.72 |
-4.30 |
-3.89 |
3.06 |
0.05 |
|
Manufacturing |
1.17 |
4.77 |
-2.67 |
1.93 |
5.40 |
0.01 |
0.98 |
4.15 |
-1.17 |
|
Utilities |
0.23 |
2.89 |
-0.35 |
-3.33 |
3.72 |
-1.71 |
-3.89 |
3.06 |
0.05 |
|
Construction |
5.70 |
11.36 |
13.52 |
6.76 |
3.72 |
6.41 |
6.32 |
8.16 |
11.44 |
|
Trade, hotel and restaurant |
3.13 |
6.65 |
0.62 |
8.34 |
1.88 |
1.12 |
6.24 |
2.86 |
1.01 |
|
Transport, storage and communication |
7.24 |
6.55 |
2.66 |
4.26 |
3.48 |
1.60 |
5.01 |
3.61 |
2.56 |
|
Fin+Insu+RE+B.Servi |
0.23 |
13.96 |
3.35 |
5.41 |
9.73 |
6.23 |
2.18 |
6.06 |
7.02 |
|
Cm+Social+Persservi |
-1.38 |
1.60 |
0.51 |
-1.44 |
2.86 |
1.15 |
-1.90 |
1.29 |
1.32 |
|
All non-farm |
1.87 |
5.76 |
2.94 |
3.32 |
3.68 |
1.67 |
2.23 |
3.72 |
2.53 |
Source: Estimates based on ‘Employment and Unemployment Survey’ of NSSO during 1993-94, 1999-00, 2004-05 and 2009-10.
|
|
1993-94/9900 |
1999-00/04-05 |
2004-05/09-10 |
|
Agriculture |
|||
|
Rural Males |
0.00 |
0.89 |
0.01 |
|
Rural Females |
-0.43 |
3.25 |
-4.28 |
|
Urban Males |
-2.62 |
2.13 |
1.66 |
|
Urban Females |
-4.13 |
6.18 |
-6.56 |
|
Mining Quarrying |
|||
|
Rural Males |
-1.93 |
2.33 |
7.15 |
|
Rural Females |
-4.95 |
3.76 |
-3.33 |
|
Urban Males |
-3.30 |
3.43 |
-3.00 |
|
Urban Females |
-5.19 |
-8.08 |
6.83** |
|
Manufacturing |
|||
|
Rural Males |
1.33 |
3.96 |
-1.26 |
|
Rural Females |
1.10 |
5.86 |
-5.50 |
|
Urban Males |
1.99 |
4.43 |
0.48 |
|
Urban Females |
1.37 |
9.04 |
-1.70 |
|
Utilities |
|||
|
Rural Males |
-5.95 |
2.33 |
1.16 |
|
Rural Females |
- |
- |
- |
|
Urban Males |
-3.91 |
3.43 |
-0.69 |
|
Urban Females |
-5.19 |
5.58 |
13.16** |
|
Construction |
|||
|
Rural Males |
6.51 |
11.14 |
11.98 |
|
Rural Females |
3.11 |
10.40 |
23.95 |
|
Urban Males |
6.86 |
4.60 |
6.47 |
|
Urban Females |
4.14 |
0.76 |
2.79 |
|
Trade, hotel and restaurant |
|||
|
Rural Males |
4.24 |
6.50 |
0.92 |
|
Rural Females |
-1.09 |
8.50 |
-1.12 |
|
Urban Males |
7.98 |
2.43 |
1.26 |
|
Urban Females |
10.71 |
-1.08 |
-1.65 |
|
Transport, storage and communication |
|||
|
Rural Males |
7.11 |
5.91 |
2.71 |
|
Rural Females |
-0.28 |
19.19* |
-3.33 |
|
Urban Males |
4.01 |
4.02 |
1.42 |
|
Urban Females |
7.09 |
0.41 |
-1.49 |
|
Services* |
|||
|
Rural Males |
4.43,-2.10 |
9.46,0.44 |
1.16,0.36 |
|
Rural Females |
-0.28,1.18 |
3.76,4.89 |
11.04,-0.01 |
|
Urban Males |
5.75,-2.44 |
9.19,1.21 |
6.14,1.86 |
|
Urban Females |
6.19,0.71 |
10.93,6.24 |
6.38,-0.37 |
|
All Non-farm Sector |
|||
|
Rural Males |
2.36 |
5.55 |
3.30 |
|
Rural Females |
0.65 |
6.30 |
0.91 |
|
Urban Males |
3.31 |
3.50 |
2.00 |
|
Urban Females |
2.93 |
5.48 |
-0.50 |
Source: NSSO Reports on Employment during 1993-94, 1999-00, 2004-05 and 2009-10
Note: in service column first entry for Fin+Ins+RE+B.Ser; second entry for Comm. +Social+PersSer;** high due to small sample size.
In India, the reported status of a workers as ‘employed’ does not necessarily imply a reasonable level of earnings; nor does it reflects the status of living of workers (See Annual Report to the People on Employment, July,2010). It is evident from the fact that while the unemployment rate even by the highest estimate was 8.3 percent, the percent of people living below the poverty line was as high as 28 percent in 2004-05. Therefore, problem is not only of unemployment, the earnings from their present employment are also very low. The analysis of quality of employment now becomes as important as the quantity of employment.
To analyze the qualitative aspect of employment we consider some characteristics of employment in India.
i) Presence of underemployment
The NSS data presents a comparative account of usually employed persons and persons employed on the basis of Current Daily Status (CDS) during a year; the difference in the level of employment reveals underemployment in the rural sector. Here underemployment means that the person employed on the basis of their usual status are not getting employment for a sufficient number of man days to be termed as employed on the basis of CDS (Jha, 2007). Table-6 presents the percent distribution of usually employed persons by their broad CDS of employment. It shows that the proportion of man days of the usually employed utilized for work, in rural and urban areas, was about 92 percent and 96 percent respectively for males and 69 percent and 85 percent respectively for females during the year 2009-10. The Table-6 also indicates that out of one hundred usually employed rural males more than 8 percent of rural males were either unemployed or not in the labour force during the year 2009-10. The same percentage, for their female counterparts was high as 31% in the year 2009-10. Under employment is highest among the rural females. It is important to note that in the current daily status, most of the females classified as workers in the usual status withdraw from the labour force rather than reporting themselves as unemployed, resulting in significantly higher percentage of the usually working females ‘not in the labour force’ in the CDS and the percentage is significant for rural females (26.5%) in the year 2009-10.
|
CDS |
R-M |
R-F |
U-M |
U-F |
||||||||||||
|
1993-94 |
1999-00 |
2004-05 |
2009-10 |
1993-94 |
1999-00 |
2004-05 |
2009-10 |
1993-94 |
1999-00 |
2004-05 |
2009-10 |
1993-94 |
1999-00 |
2004-05 |
2009-10 |
|
|
Employed |
90.9 |
89.7 |
89.3 |
91.6 |
66.4 |
67.6 |
65.7 |
69.2 |
94.8 |
94.2 |
94.5 |
96.1 |
76.6 |
79.1 |
79.8 |
84.6 |
|
Unemployed |
4.0 |
5.2 |
6.1 |
4.7 |
3.0 |
4.1 |
4.7 |
4.3 |
2.7 |
2.7 |
3.7 |
2.3 |
2.4 |
2.2 |
3.1 |
2.4 |
|
Not in Labour Force |
5.1 |
5.1 |
4.6 |
3.8 |
30.6 |
28.3 |
29.6 |
26.5 |
2.5 |
3.1 |
1.9 |
1.6 |
21.0 |
18.7 |
17.1 |
13.1 |
|
All |
100 |
100 |
100 |
100 |
100 |
100 |
100 |
100 |
100 |
100 |
100 |
100 |
100 |
100 |
100 |
100 |
Source: Estimates based on ‘Employment and Unemployment Survey’ of NSSO during 1993-94, 1999-00, 2004-05 and 2009-10.
Chart - 5: Proportion of man days of the usually employed utilized for work
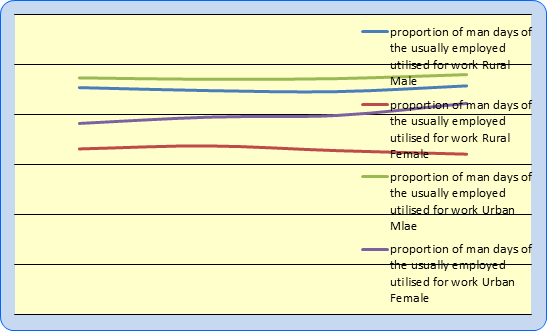
Source: Table-6
ii) Increasing Casualisation within the non-farm sector:
Mode of employment mainly characterized as self employed, regular and casual, is usually used as a broad indicator of assessing quality of employment of employed persons.Table-7a shows the percentage distribution of non-farm workers by status of employment. The percentage share of casual employment shows an increasing trend during 1993-94 to 2009-10. The share of self-employment decreases during the period 2004-05/2009-10.Table-7b shows growth of non-farm employment by status. Growth rate of self-employment and regular employed non-farm workers show a declining trend. The growth rate of casual employment increases from 4.04 percent during 1993-94/1999-00 to 7.99 percent during 2004-05/2009-10.
Table - 7a: Percentage Distribution of Rural Non-farm workers by Status
|
Percentage Distribution of Non-farm workers by Status |
||||
|
|
1993-94 |
1999-00 |
2004-05 |
2009-10 |
|
SE |
51.06 |
48.96 |
49.58 |
43.65 |
|
RE |
25.56 |
24.50 |
23.53 |
21.43 |
|
CL |
23.38 |
26.54 |
26.89 |
34.92 |
Source: Estimates based on ‘Employment and Unemployment Survey’ of NSSO during 1993-94, 1999-00, 2004-05 and 2009-10.
Chart - 6: Percentage distributions of Rural Non-farm workers by Status of Employment
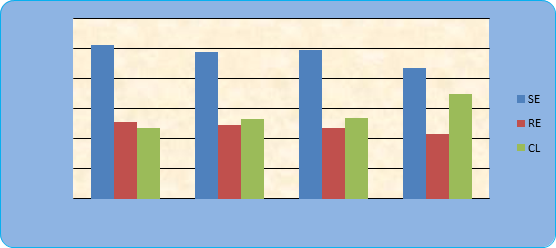
Source: Table-7 a
Table-7b: Growth of Rural Non-farm Employment by Status
|
Growth of Rural Non-farm Employment by Status |
|||
|
199394/1999-00 |
1999-00/2004-05 |
2004-05/2009-10 |
|
|
SE |
1.16 |
5.85 |
0.51 |
|
RE |
1.16 |
4.74 |
1.19 |
|
CL |
4.04 |
6.49 |
7.99 |
Source: Estimates based on ‘Employment and Unemployment Survey’ of NSSO during 1993-94, 1999-00, 2004-05 and 2009-10.
Chart - 7: Percentage of Annual Compound Growth of Rural Non-farm workers by status
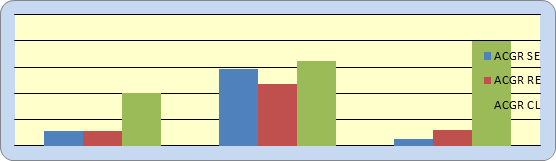
Source: Table-7b
In India approximately 54 percent of the rural labour force and 41 percent of the urban labour force are self-employed (see Table-8). The proportion of self-employed has shown significant increase during the period 1999-00/2004-05 but it shows a declining trend in between 2004-05/2009-10. Regular employed has remained stagnant at around as low as 7 percent in rural areas and 41 percent in urban areas in the period 2009-10. One depressing feature of the labour market is the recent increase in casual employment at the cost of self- employment, with the proportion of the latter declining from 60.14 percent to 54.17 percent in rural areas and from 45.48 percent to 41.14 percent in urban areas between 2004-05/2009-10 (Table-8). We get the same trend in the urban areas if we consider farm and non-farm sector separately. However, non-farm regular workers in rural areas show a marginal increase during the period 2004-05 and 2009-10.
We have computed an index of casualisation (ICL) for all workers and also for non-agricultural workers.ICL are defined as
ICL= (percentage share of casual workers/percentage share of regular workers)*100.
Table-8 (last column) reveals that casualisation of non-farm workers is more in the rural areas than the urban areas. It is more significant among the females compare to their male counterparts. Index of casualisation for all workers also shows significant presence of casual employment in the rural area for both male and female workers. Again the intensity is more for females than rural males.
|
|
|
SE |
RWE |
CL |
ICL-ALL |
ICL-NON-AGRI |
||||||
|
|
|
AGRI |
NON-AGRI |
ALL |
AGRI |
NON-AGRI |
ALL |
AGRI |
NON-AGRI |
ALL |
||
|
RURAL MALE |
1993-94 |
45.21 |
12.30 |
57.50 |
1.45 |
7.05 |
8.50 |
27.49 |
6.15 |
33.63 |
396 |
87 |
|
1999-00 |
41.81 |
13.18 |
54.99 |
1.32 |
7.72 |
9.04 |
28.25 |
7.72 |
35.97 |
398 |
100 |
|
|
2004-05 |
42.49 |
15.75 |
58.24 |
0.92 |
8.06 |
8.97 |
23.26 |
9.52 |
32.78 |
365 |
118 |
|
|
2009-10 |
38.21 |
15.36 |
53.38 |
0.73 |
8.59 |
23.95 |
13.16 |
37.29 |
434 |
164 |
||
|
RURAL FEMALE |
1993-94 |
50.61 |
8.23 |
58.84 |
0.61 |
2.13 |
2.74 |
35.06 |
3.35 |
38.41 |
1402 |
157 |
|
1999-00 |
48.16 |
9.03 |
57.19 |
0.67 |
2.68 |
3.34 |
36.45 |
3.01 |
39.46 |
1181 |
112 |
|
|
2004-05 |
53.82 |
9.79 |
63.61 |
0.31 |
3.06 |
3.36 |
29.05 |
3.36 |
32.42 |
965 |
110 |
|
|
2009-10 |
46.74 |
8.81 |
55.56 |
0.38 |
4.21 |
4.60 |
32.18 |
5.36 |
37.55 |
816 |
127 |
|
|
RURAL PERSON |
1993-94 |
47.07 |
10.81 |
57.88 |
1.13 |
5.41 |
6.53 |
30.18 |
4.95 |
35.14 |
538 |
91 |
|
1999-00 |
44.12 |
11.51 |
55.64 |
0.96 |
5.76 |
6.71 |
31.18 |
6.24 |
37.41 |
558 |
108 |
|
|
2004-05 |
46.47 |
13.44 |
60.14 |
0.68 |
6.38 |
7.06 |
25.28 |
7.29 |
32.57 |
461 |
114 |
|
|
2009-10 |
40.69 |
13.48 |
54.17 |
0.49 |
6.62 |
7.35 |
26.47 |
10.78 |
37.25 |
507 |
163 |
|
|
URBAN MALE |
1993-94 |
5.37 |
36.28 |
41.65 |
0.38 |
41.65 |
42.03 |
3.07 |
12.86 |
15.93 |
38 |
31 |
|
1999-00 |
4.05 |
37.45 |
41.51 |
0.39 |
41.31 |
41.70 |
2.12 |
14.29 |
16.41 |
39 |
35 |
|
|
2004-05 |
3.15 |
29.10 |
32.24 |
0.26 |
28.96 |
29.23 |
1.05 |
9.31 |
10.35 |
35 |
32 |
|
|
2009-10 |
3.87 |
37.20 |
41.07 |
0.18 |
41.62 |
41.80 |
1.84 |
14.73 |
16.57 |
40 |
35 |
|
|
URBAN FEMALE |
1993-94 |
14.19 |
30.97 |
45.16 |
0.00 |
28.39 |
28.39 |
10.32 |
15.48 |
25.81 |
91 |
55 |
|
1999-00 |
9.35 |
35.97 |
45.32 |
0.72 |
32.37 |
33.09 |
7.91 |
12.95 |
20.86 |
63 |
40 |
|
|
2004-05 |
11.45 |
36.75 |
48.19 |
0.60 |
35.54 |
36.14 |
6.63 |
10.24 |
16.87 |
47 |
29 |
|
|
2009-10 |
7.25 |
34.06 |
41.30 |
0.00 |
39.13 |
39.13 |
6.52 |
13.04 |
18.84 |
48 |
33 |
|
|
URBAN PERSON |
1993-94 |
7.20 |
35.16 |
42.36 |
0.29 |
39.19 |
39.48 |
4.61 |
13.54 |
18.16 |
46 |
35 |
|
1999-00 |
5.04 |
37.39 |
42.43 |
0.30 |
39.76 |
40.06 |
3.26 |
13.95 |
17.21 |
43 |
35 |
|
|
2004-05 |
5.75 |
39.73 |
45.48 |
0.27 |
39.18 |
39.45 |
2.47 |
12.33 |
15.07 |
38 |
31 |
|
|
2009-10 |
4.57 |
36.29 |
41.14 |
0.29 |
41.14 |
2.86 |
14.29 |
17.14 |
41 |
35 |
||
Source: Estimates based on ‘Employment and Unemployment Survey’ of NSSO during 1993-94, 1999-00, 2004-05 and 2009-10.
![]() Note: AGRI=Sections A+B according
to NIS code 2004.Non-Agri= Sections C to Q according to NIS code 2004.
Note: AGRI=Sections A+B according
to NIS code 2004.Non-Agri= Sections C to Q according to NIS code 2004.
iii) Wages and Earnings:
a) Average daily wage and Gender Bias in wage payment:
Casual wage labourers are one of the most disadvantaged groups in the labour market. Poor working condition, low wages push them below poverty line. As shown in Table-9a in 2004-05, the average daily wage of casual males and females was Rs 55 and Rs 35 respectively in rural areas and Rs 75 and Rs 44 respectively in urban areas. In 2009-10, the same for rural males and females was Rs 101.53 and Rs 68.94 respectively and in urban areas the average daily wage was Rs 131.92 for males and Rs 76.73 for females. On an average the casual workers received far less wages than those received by regular workers.
In addition to low wage of casual workers, there is also gender bias[1] in wage payments. It is important to note that the gender bias in casual wage payment is low in rural areas (0.63 in 2004-05 and 0.68 in 2009-10) than in urban areas (0.58 both in 2004-05 and in 2009-10). Gender bias is also noticeable in case of regular workers and it is more in rural area than in urban area.
Table-9a: Average Daily Wage (in Rs.) of Regular and Casual Workers (15-59 Years)
|
Segment |
2004-05 |
2009-10 |
||||
|
|
M |
F |
IGB |
M |
F |
IGB |
|
|
Regular |
|||||
|
Rural |
144.93 |
85.53 |
0.59 |
249.15 |
155.87 |
0.63 |
|
Urban |
203.28 |
153.19 |
0.75 |
377.16 |
308.79 |
0.82 |
|
Casual |
||||||
|
Rural |
55.03 |
34.94 |
0.63 |
101.53 |
68.94 |
0.68 |
|
Urban |
75.10 |
43.88 |
0.58 |
131.92 |
76.73 |
0.58 |
Source: Estimates based on ‘Employment and Unemployment Survey’ of respective NSS Rounds, 1993-94, 1999-00, 2004-05 and 2009-10
b) Decline in the growth rate of Real Wage of Adult Casual Labourers during the first decade of twenty-first century compare to the early years of economic liberalisation:
Table-9b shows that there was a significant slowdown in the growth rate of real wage of casual workers during the first decade of twenty-first century compare to the early years of economic liberalisation. The decline in the growth rate of real wages of non-farm casual workers is more significant than that of the farm workers in rural areas.
For urban male and female workers, the growth rate of real wage[2] show a declining trend. Again, the decline is more significant for non-farm urban workers than the farm workers.
|
Segment/Period |
1993-94 / 1999-00 |
1999-00 / 2009-10 |
|
Rural Males |
|
|
|
Farm |
2.78 |
2.21 |
|
Non- Farm |
3.70 |
1.86 |
|
All Activities |
3.59 |
2.67 |
|
Rural Females |
|
|
|
Farm |
2.94 |
2.84 |
|
Non- Farm |
4.07 |
2.92 |
|
All Activities |
5.04 |
3.18 |
|
Urban Males |
|
|
|
Farm |
2.73 |
1.67 |
|
Non- Farm |
2.93 |
1.43 |
|
All Activities |
3.09 |
1.52 |
|
Urban Females |
|
|
|
Farm |
2.96 |
2.21 |
|
Non- Farm |
4.18 |
0.69 |
|
All Activities |
3.91 |
1.13 |
Source: 1. For rural areas, an estimate for the period 1993-94/1999-00 is taken from Sundaram (2001, 2007).
2. For Urban areas, an estimate for the period 1993-94/1999-00 is drawn from Sundaram (2007).
3. For the period 1999-00/2009-10, growth rates of real wages in both rural and urban areas have been computed from published reports (Nos. 515 and 537) of NSS Employment-Unemployment Surveys for 1999-00 and 2009-10.
4. We used CPI for Agricultural Labour (CPIAL) and CPI for Industrial Workers (CPIIL) of respective periods to derive the growth rate of real wage.
1.6. Incidence and Growth of Employment in different sectors in West Bengal
Our particular emphasis will be on West Bengal. This is due to the fact that in spite of significant set back in the growth rate of non-farm employment in rural areas in all-India; West Bengal shows a significant increase in growth rateof rural non -farm employment both for males and females. The growth rate is more pronounced for male than rural female.
Some Observations:
i) An important aspect to analyse employment situation in West Bengal is to examine the mode of employment. Table-10 shows changing mode of employment. It is clear to see that, there are increasing trend in casual worker and declining trend for regular workers in rural areas except for rural female regular workers which shows a marginal increase over the period 2004-05/2009-10.The share of self employment activities show a declining trend during 2004-05/2009-10.Therefore, casual employment increases at the cost of self-employment.
Table- 10: Percentage of Usually Employed persons (PS+SS) by type of Employment: Rural
|
Year |
Rural Male |
Rural Female |
Rural Person |
||||||
|
SE |
RWE |
CL |
SE |
RWE |
CL |
SE |
RWE |
CL |
|
|
1993-94 |
54.7 |
10.3 |
35.0 |
59.0 |
7.3 |
33.7 |
55.7 |
9.5 |
34.8 |
|
1999-00 |
49.2 |
7.5 |
43.3 |
62.4 |
5.1 |
32.5 |
52.2 |
7.0 |
40.8 |
|
2004-05 |
53.4 |
7.3 |
39.3 |
61.0 |
8.3 |
30.7 |
55.2 |
7.5 |
37.3 |
|
2009-10 |
45.2 |
8.3 |
46.4 |
50.9 |
8.9 |
40.3 |
46.3 |
8.4 |
45.3 |
ii) Source: Computed from NSSO reports on Employment and Unemployment for the years 1993-94, 1999-00.2004-05 and 2009-10.
ii)Now we consider the extent of diversification of employment. The percentage share of Non-farm employment shows fluctuations over the period, but the absolute number of workers has been increasing continuously since 1993-94 (see Table-11a).As shown in Table-11b, in West Bengal, the number of rural non-farm employment increased by 472.25 thousand persons per year during 2004-05 and 2009-10 as against 10.37 thousand persons per year in 1993-94 and 1999-00.If we consider, average yearly change of rural non -farm employment separately for male and female workers, it emerges that increased has been more pronounced in case of male workers than female workers during the period 1993-94 to 2009-10.Table-11b shows that non -farm employment increased by 319.55 thousand persons per year during 2004-05 and 2009-10 for rural males against only 109.10 thousand persons per year for the females.
ii) Table-12 and Chart: 8 shows the growth rate of rural non -farm employment by usual status (PS+SS).The trend is clear for an increase in the growth of non -farm employment, though this is much higher for rural females. The growth rates for females also show an increasing trend during the reference period. Importantly, more than 50 percent of female workers engaged in usual status activity in rural West Bengal were working in non -farm sector. Therefore, overall decline in the growth of employment suggest that job losses for females will be more in agriculture, rather than a significant expansion of non -farm employment.
Table-11a: Computation of Non-farm Employment by Sex for the mid-points of NSSO rounds
|
NFE as % total workers(PS+SS) |
Total NFE(PS+SS) (in ‘000) 1993-94 |
|||||
|
1993-94 |
||||||
|
|
Male |
Female |
|
Male |
Female |
Persons |
|
Rural |
35.1 |
40.4 |
Rural |
5208 |
1909 |
7103 |
|
Urban |
95.6 |
91.4 |
Urban |
5550 |
1172 |
6758 |
|
|
|
|
Total |
10758 |
3081 |
13861 |
|
1999-00 |
|
1999-00 |
||||
|
Rural |
34.0 |
47.4 |
Rural |
5225 |
2002 |
7165 |
|
Urban |
96.8 |
97.7 |
Urban |
6472 |
1216 |
7607 |
|
|
|
|
Total |
11697 |
3218 |
14772 |
|
2004-05 |
|
2004-05 |
||||
|
Rural |
36.2 |
41.3 |
Rural |
6434 |
2166 |
8519 |
|
Urban |
97.3 |
96.9 |
Urban |
7188 |
1686 |
8843 |
|
|
|
|
Total |
13622 |
3852 |
17362 |
|
2009-10 |
|
2009-10 |
||||
|
Rural |
40.6 |
57.6 |
Rural |
8032 |
2711 |
10880 |
|
Urban |
96.6 |
95.3 |
Urban |
7398 |
1619 |
8955 |
|
|
|
|
Total |
15430 |
4330 |
19835 |
Source: Computed from NSSO reports on Employment and Unemployment for the years 1993-94, 1999-00.2004-05 and 2009-10.
Table - 11b: Average yearly change of Rural Non-farm Employment in West Bengal (US-PS+SS Basis)
|
Average yearly change(in ‘000) |
Male |
Female |
Person |
|
1993-94 and 1999-00 |
2.82 |
15.36 |
10.37 |
|
1999-00 and 2004-05 |
241.91 |
32.81 |
270.81 |
|
2004-05 and 2009-10 |
319.55 |
109.10 |
472.25 |
Source: Computed from NSSO reports on Employment and Unemployment for the years 1993-94, 1999-00.2004-05 and 2009-10.
Table-11c: Percentage of Rural Non-Farm workers to total workers in West Bengal US-PS basis
|
Sex of workers |
1993-94 |
1999-00 |
2004-05 |
2009-10 |
|
Male |
35.8 |
33.7 |
36.0 |
40.9 |
|
Female |
55.1 |
42.8 |
46.0 |
58.0 |
|
Person |
38.3 |
35.3 |
37.5 |
42.9 |
Source: Source: Computed from NSSO reports on Employment and Unemployment for the years 1993-94, 1999-00.2004-05 and 2009-10.
|
Sex of workers |
1993-94/1999-00 |
1999-00/2004-05 |
2004-05/2009-10 |
|
Male |
0.05 |
4.25 |
4.54 |
|
Female |
0.79 |
1.59 |
4.60 |
|
Person |
0.15 |
3.52 |
5.01 |
Source: Computed from NSSO reports on Employment and Unemployment for the years 1993-94, 1999-00.2004-05 and 2009-10.
Chart - 8: Annual Compound Growth Rate of Rural Non-farm Employment
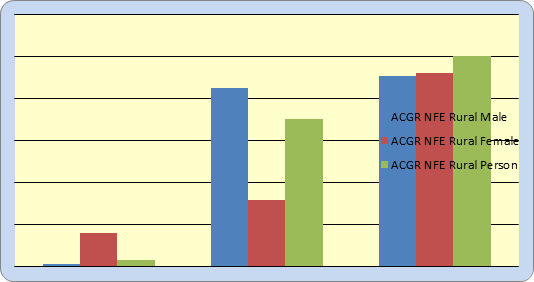
Source: Table-12
iii) Tables-13a, Chart-9 and 13b show the annual compound growth rate of employment (on the basis of US-PS+SS) in the rural and urban areas and also for males and females. Considering the overall growth rate of non-farm employment during the period 1993-94 to 2009-10, for rural workers, it increases from 0.15 percent during 1993-94/1999-00 to 5.01 percent during 2004-05/2009-10.For urban workers, it shows fluctuations. It increases from 1.99 percent during 1993-94/1999-00 to 3.06 percent during 1999-00/2004-05.But it decreases to 0.25 percent during 2004-05/2009-10. For all workers (Rural+Urban) the growth rate of non-farm employment shows an increasing trend during 1993-94/1999-00 to 1999-00/2004-05 (from 1.07 percent to 3.28 percent) but shows a declining trend during 2004-05/2009-10.
iv) Non-farm sector consists of heterogeneous set of activities. Considering the employment growth of individual sector, highly disparate trends are discernable during the reference period. For rural workers, construction, manufacturing, transport-storage-communication, community-social-personal services are important in terms of growth of employment. For urban workers the corresponding sectors are utilities, construction and trade-hotel-restaurant.
For rural male workers, the growth rate of non-farm employment shows steady increase during 1993-94/1999-00 to 2004-05/2009-10 (from 0.05 percent to 4.54 percent). Same trend is discernable for rural females. Considering the growth rates of individual sectors, for rural males, important sectors (in terms of growth of employment) are manufacturing, construction, transport-storage-communication and community-social-personal services. For rural females, the corresponding sectors are construction, trade-hotel-restaurant, community-social-personal services and manufacturing.
For both males and females in the urban areas the growth rates of non-farm employment show a steady increase during 1993-94/1999-00 and 1999-00/200405 but show a steady decline during 2004-05/2009-10 and it is negative for urban females. Positive employment growth is discernable for the sectors utilities, trade-hotel-restaurant and construction sectors and the employment growth of all other sectors is negative both for urban male and female workers.
|
|
RURAL PERSON |
URBAN PERSON |
RURAL+URBAN Person |
||||||
|
|
1993-94/ 1999-00 |
1999-00/ 2004-05 |
2004-05/ 2009-10 |
1993-94/ 1999-00 |
1999-00/ 2004-05 |
2004-05/ 2009-10 |
1993-94/ 1999-00 |
1999-00/ 2004-05 |
2004-05/ 2009-10 |
|
Agriculture |
0.32 |
2.78 |
-0.56 |
-6.98 |
1.58 |
5.64 |
0.14 |
2.76 |
-0.44 |
|
Mining and Quarrying |
7.24 |
-4.96 |
30.58* |
-13.48 |
7.69 |
-9.30 |
-7.01 |
2.34 |
10.93** |
|
Manufacturing |
0.75 |
-1.10 |
5.93 |
-1.08 |
4.47 |
-0.20 |
0.02 |
1.17 |
3.36 |
|
Utilities |
0.24 |
3.07 |
- |
4.76 |
-13.55 |
4.19 |
3.87 |
-9.70 |
-3.97 |
|
Construction |
-1.21 |
15.58 |
10.41 |
4.86 |
2.34 |
0.46 |
1.74 |
9.27 |
6.99 |
|
Trade, hotel and restaurant |
2.35 |
5.39 |
1.42 |
7.93 |
1.14 |
3.17 |
5.12 |
3.17 |
2.30 |
|
Transport, storage and communication |
3.65 |
4.88 |
5.32 |
6.82 |
1.86 |
-0.70 |
5.39 |
3.19 |
2.25 |
|
Fin+Insu+RE+B.Servi |
0.24 |
21.22 |
-0.73 |
3.79 |
7.49 |
-3.74 |
3.03 |
10.70 |
-2.79 |
|
Cm+Social+Persservi |
-5.67 |
5.06 |
3.77 |
-1.48 |
3.82 |
-0.89 |
-3.16 |
4.28 |
0.97 |
|
All non-farm |
0.15 |
3.52 |
5.01 |
1.99 |
3.06 |
0.25 |
1.07 |
3.28 |
2.70 |
Source: Computed from NSSO reports on Employment and Unemployment for the years 1993-94, 1999-00.2004-05 and 2009-10.
Chart - 9: Annual Compound Growth Rates of workers in the Farm and the Non-farm Sectors
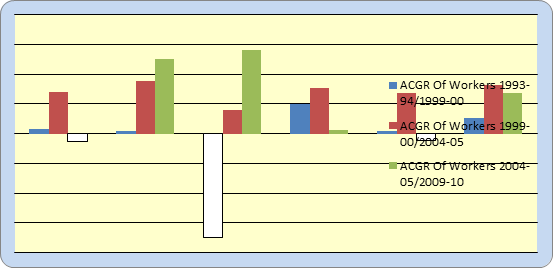
Source: Table-13a
|
|
1993-94/9900 |
1999-00/04-05 |
2004-05/09-10 |
|
Agriculture |
|||
|
Rural Males |
1.32 |
1.86 |
0.63 |
|
Rural Females |
-2.44 |
5.55 |
-8.36 |
|
Urban Males |
-2.89 |
-1.35 |
5.43 |
|
Urban Females |
-20.40 |
13.55 |
8.56 |
|
Mining Quarrying |
|||
|
Rural Males |
13.24 |
-3.09 |
13.10 |
|
Rural Females |
- |
- |
65.84** |
|
Urban Males |
-13.04 |
4.23 |
-6.25 |
|
Urban Females |
-10.08 |
10.95 |
-30.48** |
|
Manufacturing |
|||
|
Rural Males |
-0.30 |
-1.43 |
8.40 |
|
Rural Females |
2.05 |
-0.72 |
2.95 |
|
Urban Males |
-0.64 |
2.46 |
-0.20 |
|
Urban Females |
-1.88 |
11.64 |
-0.36 |
|
Utilities |
|||
|
Rural Males |
0.88 |
2.65 |
- |
|
Rural Females |
- |
- |
- |
|
Urban Males |
5.06 |
-13.85** |
6.64 |
|
Urban Females |
- |
- |
- |
|
Construction |
|||
|
Rural Males |
0.88 |
16.11 |
9.22 |
|
Rural Females |
-21.46 |
8.54 |
12.38 |
|
Urban Males |
5.27 |
2.89 |
0.68 |
|
Urban Females |
3.16 |
-7.88 |
-20.15 |
|
Trade, hotel and restaurant |
|||
|
Rural Males |
3.01 |
4.96 |
0.45 |
|
Rural Females |
-0.44 |
7.91 |
3.93 |
|
Urban Males |
7.65 |
1.46 |
3.17 |
|
Urban Females |
17.80 |
-4.46 |
3.17 |
|
Transport, storage and communication |
|||
|
Rural Males |
4.00 |
4.53 |
4.65 |
|
Rural Females |
- |
- |
29.09 |
|
Urban Males |
7.47 |
1.74 |
-0.76 |
|
Urban Females |
-4.66 |
-10.94 |
14.27 |
|
Services* |
|||
|
Rural Males |
-2.80,-7.01 |
25.67,3.53 |
-1.90,1.25 |
|
Rural Females |
-1.05,-0.28 |
3.80,8.41 |
34.98,6.44 |
|
Urban Males |
4.34,-1.79 |
6.81,2.06 |
-2.99,-0.44 |
|
Urban Females |
-3.79,-0.70 |
14.42,6.59 |
-8.27,-1.34 |
|
All Non-farm Sector |
|||
|
Rural Males |
0.05 |
4.25 |
4.54 |
|
Rural Females |
0.79 |
1.59 |
4.60 |
|
Urban Males |
2.60 |
2.12 |
0.58 |
|
Urban Females |
0.61 |
6.75 |
-0.82 |
Source: NSSO Different Rounds
Note: in service column first entry for Fin+Ins+RE+B.Ser; second entry for Comm.+Social+PersSer;** high due to small sample.section the extent of overall employment diversification away from agriculture by districts; using data from the 1991 and 2001 Census (see Table-5.9).
Chart: 10 Properties of Rural Non-farm Employment
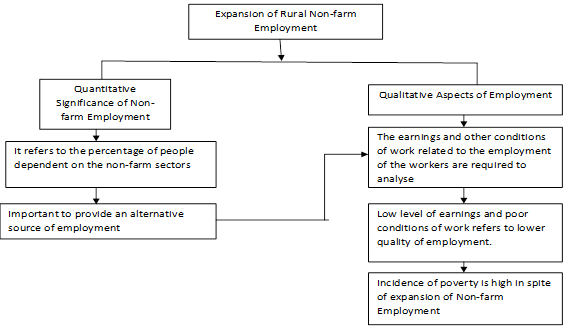
1.7. Summary of findings and concluding observations:
Both the absolute number and the percentage share of non-farm employment increase throughout India since 1993-94.It is stated that non-farm sector consists of heterogeneous set of activities. At the all-India level, in 2009-10, the sectoral composition of non-farm employment depicted that construction sector accounted for the highest percentage of male non-farm employment followed by trade, manufacturing, community-social and personal services and transport. For females, manufacturing sector alone accounted for more than 50 percent of employment followed by construction sector, services and trade.
However, the growth rate of rural non-farm employment shows a declining trend during 2004-05 and 2009-10. It is more pronounced for females. For rural workers as a whole, the important sectors in terms of growth of employment are construction, transport-storage-communication, finance - real estate-insurance, mining and quarrying. For urban workers, the important sectors are construction, transport-storage-communication, finance-real estate-insurance.
Now, the reported status of workers as ‘employed’ does not entail with reasonable level of earnings. This is evident from the fact that in spite of employment growth, the percentage share of people living below the poverty line is significant (28 percent in 2004-05). This raises question about the earnings from activities in which workers are employed and their conditions of work. Therefore, quality of employment now becomes a determining issue.
Concentration of employment in the unorganized sectors, increasing casualisation of work force particularly for female, presence of underemployment, decrease in the growth rate of real wages of casual workers, gender bias in wage payments are depressing features of Indian labour market.
For West Bengal analysis of secondary data (based on NSSO for the reference period) reveals that the overall growth rate of employment shows a declining trend during 2004-05/2009-10 and it turns out to be negative for female workers (both in the rural and urban areas). Now, given this overall stagnation of employment growth, the growth of non-farm employment shows a steady increase, particularly for females. Therefore, decline in the growth rate of employment indicates job loss for females will be more in the agricultural sector, rather than a significant expansion of non-farm employment.
Non-farm sector consists of different set of activities. We have computed the annual compound growth rate of employment of different sectors. Secondary data analysis reveals that for rural workers as a whole the important sectors in terms of growth of employment are construction, manufacturing, transport-storage-communication and community-social-personal services. For urban workers, the important sectors are trade, hotel and restaurant; construction and utilities.
Policy Measures:
In overall employment trend, there shows a declining trend for female employment.
Under-employment of female worker, more participation in casual work, gender bias in wage payment are depressing features of the Indian Labour Market. So, the expansion of self-employment activities are required for better livelihood for the female workers.
References:
1. Acharya, S and A. Mitra. (2000), The Potential of Rural Industries and Trade to Provide Decent Work Conditions: A Data Reconnaissance in India, SAAT Working Paper, South Asia Multidisciplinary Advisory Team, International Labour Organisation, New Delhi.
2. Bhalla, S, (1987) “Trends in Employment in Indian Agriculture, Land and Asset Distribution”, Indian Journal of Agricultural Economics, Vol-42, no.4, October-December.
3. ………. (1990) “A Theoretical Framework for a study of Rural Labour Markets”. The Indian Journal of Labour Economics, Vol-33, no. 2, April-June.
4. ……….. (1993a) “Pattern of Employment Generation”, The Indian Journal of Labour Economics, Vol-39 no. 1, pp 1-12.
5. .............. (1997) The Rise and Fall of Workforce Diversification Process in Rural India, in G.K.Chadha and Alakh N Sharma (edt), op cit., pp 145-183.
6. ............... (2007), “Inclusive Growth? Focus on Employment.” Social Scientist, Vol.35, No.718, July-August, pp-24-43.
7. Bhalla, G.S. (2008) “Globalisation and Employment Trends in India”, The Indian Journal of Labour Economics, Vol-51, no. 1.
8. Bhaumik, S.K. (2002a), “Emerging Employment and Unemployment Scenarios in West Bengal; Implications for Policy”, Journal of Indian school of Political economy, Vol-14, no. 3, July-September.
9. ………. (2002b) “Employment Diversification in Rural India: A State Level Analysis”, The Indian Journal of Labour Economics, Vol-45, no.4.
10. Chadha, G.K.(1993), “Non Farm Employment for Rural Households in India; Evidence and Prognosis”, The Indian Journal Of Labour Economics, Vol-36(3), pp 296-327.
11. ……….. (1994), Employment, Earnings and Poverty: A Study of Rural India and Indonesia, Sage, New Delhi.
12. Chandrasekhar, C. P. (1993), “Agrarian Change and Occupational Diversification- Non Agricultural Employment and Rural Development in West-Bengal”, Journal of Peasant Studies, Vol-20, No. 2, pp 205-270.
13. Chandrasekhar, C.P and JayatiGhosh (2003), “Employment trends in West Bengal” The Hindu, July, 01, 2003.
14. Chandrasekhar, C.P. and JayatiGhosh (2006), Employment Growth: The Latest Trends. Website: file://F:/Employment Growth, the latest trend.htm.
15. Chandrasekhar, C.P. and JayatiGhosh (2006), Working More for Less. Website: file://F:/Working More for Less, C.P.Chandrasekhar.htm.
16. Jha, Brajesh (2007), Rural Non-farm Employment in India: Macro –Trends, Micro Evidences and policy options. Agriculture Economic Unit, Institute of Economic Growth.
17. National Commission for Enterprises in the Unorganised Sector (NCEUS), Government of India (2007), Report on Conditions of work and promotion of Livelihoods in the unorganised Sector, Ministry of Small Scale Industries, Government of India, New Delhi.
18. National Sample Survey Organisation (NSSO) (1997), Employment and Unemployment Situation in India-1993-94, Round 50th , Report No. 409, Ministry of Statistics and Programme Implementation, Government of India, New Delhi.
19. National Sample Survey Organisation (NSSO) (2001), Employment and Unemployment Situation in India-1999-00, Round 55th , Report No. 458-I and II (55/10/&2), Ministry of Statistics and Programme Implementation, Government of India, New Delhi.
20. National Sample Survey Organisation (NSSO) (2006), Employment and Unemployment Situation in India-2004-05, Round 61st, Report No. 515-I and II (61/10/&2), Ministry of Statistics and Programme Implementation, Government of India, New Delhi.
21. National Sample Survey Organisation (NSSO) (2011), Employment and Unemployment Situation in India-2009-10, Round 66th, Report No. 537 (66/10/1), Ministry of Statistics and Programme Implementation, Government of India, New Delhi.
22. Planning Commission (2001), Report of the Task Force on Employment Opportunities. Government of India.
A STUDY ON WOMEN EMPOWERMENT IN EDUCATION AND HEALTH SECTOR
Dr. S. Manikandan ·
ABSTRACT
Empowerment of women in India is the important function to remove poverty, inequalities, and for economic development. Economic is based on the combination of physical capital and human capital. In India’s Economic development is based on human capital. Indian human capital comprised of both male and female population. But in reality, cultural under social fact are discouraging the upliftment of female population. It is becoming a male dominated society. And it leads to be one side developments. The Government should take necessary steps to empower the female population to boost economic development and reduce the inequalities in social obligations. Women’s empowerment can be made through providing good education, health and nutrition. In Education the growth rate of enrolment of both the male and females are increasing. But the female enrolment is very low with male enrolments. Especially in upper and pre degrees the total enrolment of females are 6.3 in 1990-91 and 10.7 in 2000-01. Comparing to male enrolment is less than 6.5 million persons in 1990-91 and 6.2 million persons in 2005-06. In present scenario the birth rate of female population is declined because of cultural and social factors. When we analyze the sex ratio it is reducing from 1951 to 2011, 946 females for 1000 males and 940 females for 1000 males respectively. The people are feeling that the female are liabilities to their family. To avoid such social conflicts, we have to provide good education, health, legal protection and our society should ensure equal rights to maintain the social Justification. The government should create special policies and financial supports for female members. In present conditions the empowerment of women is necessary as well as sufficient condition for Indian economic development.
Key Words: Women Empowerment, Literacy Ratio, Mortality Rate, Nutrition.
INTRODUCTION
Women in Indian Society are regarded as Second Grade Citizens who’s every aspect of life is confined to the rigid restrictions under the goals of castes customs and traditions as envisaged in our religion as well as social customs. In other words there is a social injunction, implicit in our social customs and religion, which strictly forbids the Indian Women from participating in any outward activities. But in modern times there has been a social and cultural awakening in India and it has been seriously felt by our social reformers and educationalist that unless women are emancipated from social shackles and bondages and proper steps are taken for their education and participation in outward activities such as, social, cultural, political, economy etc. The Indian nation cannot thrive and it cannot establish itself as one of the advanced nations of the world. Discrimination of women from womb to tomb is well known. As women oppressed in all spheres of life, they need to be empowered in all walks of life in order to fight against the socially constructed gender biases. Women have to swim against the stream that requires mere strength. Such strength comes from the process of empowerment.
Empowering of women pre-supports a drastic dynamic and democratic change in the perception of and expectation from women in our society. Empowerment is a process and is not, therefore, something there can be given to people. The Process of empowerment in both individual and collective, since it is through involvement in groups that people most after begin to develop their awareness and the ability to organize to take action and bring about change. The women empowerment can be done through providing proper education, health and nutrition facilities. And the government should ensure the equality among the female group
CONCEPTS AND MEANING
It is refers to the formation of an environment for women where they can make decisions of their own for their personal benefits as well as for the society. It strengthens the inborn ability by way of acquiring knowledge, power and experience. And education is one of the most critical factors responsible for the development of a human mentality, as women play’s the crucial role in everyone’s life in relation to as a mother, daughter, wife, friend, colleagues and sister etc. they should get the proper education and health Medicare facility for the healthy environment of the society as well as for the organization factor. And empowerment is a process, where one can take a decision, action, control, exercises choice and fulfill their potential and give the suggestion overall the necessarily things. Women’s empowerment is very essential for the development of any society and the country.
Objective of the Study
Methodology of the Study
Due to wide nature of the topic the study is conducted based on the secondary data available from the following sources:
1. Review literature
2. Internet
3. Books & E-Books
4. Journals and Report
5. Dissertation
Review of Literature
Duflo E. (2011) Women’s Empowerment and Economic Development, National Bureau of Economic Research Cambridge The study argues that the inter relationships of the Empowerment and Development are probably too weak to be self sustaining and that continuous policy commitment to equally for its own sake may be needed to bring about equality between men and women.
Sethuraman K. (2008) The Role of Women’s Empowerment and Domestic Violence in child Growth and under nutrition in a Tribal and Rural Community in South India. This research paper explores the relationship between Women’s Empowerment and Domestic Violence, maternal nutritional status and the nutritional status and growth over six months in children aged 6 to 24 months in a rural and tribal community. This longitudinal observational study undertaken in rural Karnataka. India included tribal and rural subjects.
Shetty (1992) comes to the conclusion that empowerment is easy to feel but complex to define. But while it may be difficult to define it, one is able to understand its meaning when one sees the manifestation of what it implies. Thus an empowered individual would be one who experiences a sense of self-confidence and self-worth; a person who critically analyzes his/her social and political environment; a person who is able to exercise control over decisions that affect his/her life. These are, however, not the only dimensions or facets that define empowerment. But while recognizing that empowerment is multi-faceted in nature, an attempt is made in this paper to examine how a literacy campaign has brought about women's empowerment. This is done by analyzing the anti-arrack (country liquor) agitation of Nellore district of Andhra Pradesh, which has shown how literacy played a significant role in raising the consciousness of village women so that they have now spearheaded an agitation that is fast engulfing the state of Andhra Pradesh.
Giriyappa (1997) analysed the women empowerment with the corresponding levels of discrimination and effectiveness of decision-making by women in different rural enterprises and concluded that the female headed households were effective in taking decision in respect of work mobility, schooling, health care, asset creation, employment generation and social participation in low social status households. The informal empowerment was wide spread through women earning members, their decisions were subjected to various degrees of discrimination by males.
Saradha (2001) reported that the product empowerment of women in self-help groups was found to range from high and low with 35.80 and 35.00 per cent, respectively. It indicated that even though the women are psychologically empowered but their real empowerment level was low. The possible reasons for this may be the patriarchal society where the women are regarded as weaker section and the managerial competencies, decision-making power, reduction in drudgery, assessing information and resources and critical awareness of rural women were found to be low because of the lack of general media exposure, low level of education and lack of recognition.
H. Subrahmanyam (2011) compares women education in India at present and Past. Author highlighted that there has a good progress in overall enrolment of girl students in schools. The term empowers means to give lawful power or authority to act. It is the process of acquiring some activities of women.
M. Bhavani Sankara Rao (2011) has highlighted that health of women members of SHG have certainly taken a turn to better. It clearly shows that heath of women members discuss among themselves about health related problems of other members and their children and make them aware of various Government provisions specially meant for them.
Doepke M. Tertilt M. (2011) Does Female Empowerment Promote Economic Development? This study is an empirical analysis suggesting that money in the hands of mothers benefits children. This study developed a series of non cooperative family bargaining models to understand what kind of frictions can give rise to the observed empirical relationship.
Venkata Ravi and Venkatraman (2005) focused on the effects of SHG on women participation and exercising control over decision making both in family matters and in group activities.
Result and discussion
Women and Education
Empowerment is an active process. Power is not a commodity to be transacted. Power cannot be given away as alms. Power has to be acquired. Once acquired, it needs to be exercised, sustained and preserved. Women have to empower themselves. Pandit Jawaharlal Nehru once said “To awaken the people, it is women who must be awakened; once she is on the move, the family moves”, the villages moves and the nation moves”. A Women account for more than half of the world illiterate population achieving literacy could be one of the first steps to empowering women to participate more equally in society and free themselves from economic opportunity in a highly important end in it self. In addition, this also enhances their decision making capacity in vital areas, especially in the areas of reproduction. Education is one of the most important means of empowering women and giving knowledge, skills and self confidence necessary, to be full partners in the development process.
In India the female literacy rate is comparably low than the male literacy rate. The Indian society is not allowing the female to participate in equal awareness. Due to the social and cultural status there are refused to participate in equal manner in every action of life. This kind of attitude should be charged only when the women are empowered with education and health facilities. Especially in education the enrolment is schools one very low level then the male members. The following table explains the present position of female education in India:
Progress of enrolment during 1950-51 to 2005-06
Table: 1.1
(Million persons)
|
Year |
Primary ( 1-V) |
Middle/Upper (VI-VIII) |
High/Hr.Sec./Inter/Pre-Deg ( IX – XII ) |
||||||
|
Boys |
Girls |
Total |
Boys |
Girls |
Total |
Boys |
Girls |
Total |
|
|
1950 - 51 |
13.8 |
5.4 |
19.2 |
2.6 |
0.5 |
3.1 |
1.3 |
0.2 |
1.5 |
|
1960 - 61 |
23.6 |
11.4 |
35.0 |
5.1 |
1.6 |
6.7 |
2.7 |
0.7 |
3.4 |
|
1970 - 71 |
35.7 |
21.3 |
57.0 |
9.4 |
3.9 |
13.3 |
5.7 |
1.9 |
7.6 |
|
1980 - 81 |
45.3 |
28.5 |
73.8 |
13.9 |
6.8 |
20.7 |
7.6 |
3.4 |
11.0 |
|
1990 – 91 |
57.0 |
40.4 |
97.4 |
21.5 |
12.5 |
34.0 |
12.8 |
6.3 |
19.1 |
|
2000–01* |
64 .0 |
49.8 |
113.8 |
25.3 |
17.5 |
42.8 |
16.9 |
10.7 |
27.6 |
|
2001-02* |
63.6 |
50.3 |
113.9 |
26.1 |
18.7 |
44.8 |
18.4 |
12.1 |
30.5 |
|
2002-03* |
65.1 |
57.3 |
122.4 |
26.3 |
20.6 |
46.9 |
19.5 |
13.7 |
33.2 |
|
2003-04* |
68.4 |
59.9 |
128.3 |
27.3 |
21.5 |
48.7 |
20.6 |
14.4 |
35.0 |
|
2004-05* |
69.7 |
61.1 |
130.8 |
28.5 |
22.7 |
51.2 |
21.7 |
15.4 |
37.1 |
|
2005-06* |
70.5 |
61.6 |
132.1 |
28.9 |
23.3 |
52.2 |
22.3 |
16.1 |
38.4 |
Note: *P- Provisional
Source: Dept. of Education, Min. of Human Resources Development.
Chart-1
Enrollment of Men and Women in Primary Education
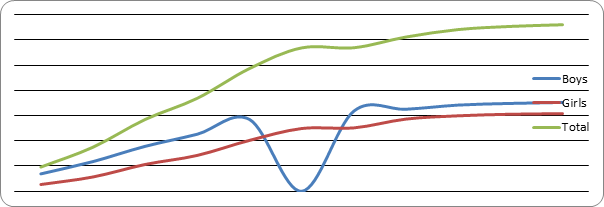
The table shows that there is interesting amount of progress in school enrolment level. But if we compare the female to male the percentage of growth is not adequate. That is in the year 1950-51, the total enrollment of female in primary is 5.4, 0.5 in Middle school levels, and 0.2 million persons in pre degree courses. In the year 1990-91 it was increases to 40.4 million persons in primary, 12.5 in upper classes and 6.3 million persons in pre degree classes. As we compared in the year 2005-06 it was further increase to 61.6 million persons in primary and 22.7 in upper class and 16.1 in pre degree classes. The table shows the strong growth in school enrollment but it is not sufficient for the future women empowerment. The table 1.2 shows the gross enrolment and net enrolment ratio at primary and upper primary level.
Table 1.2
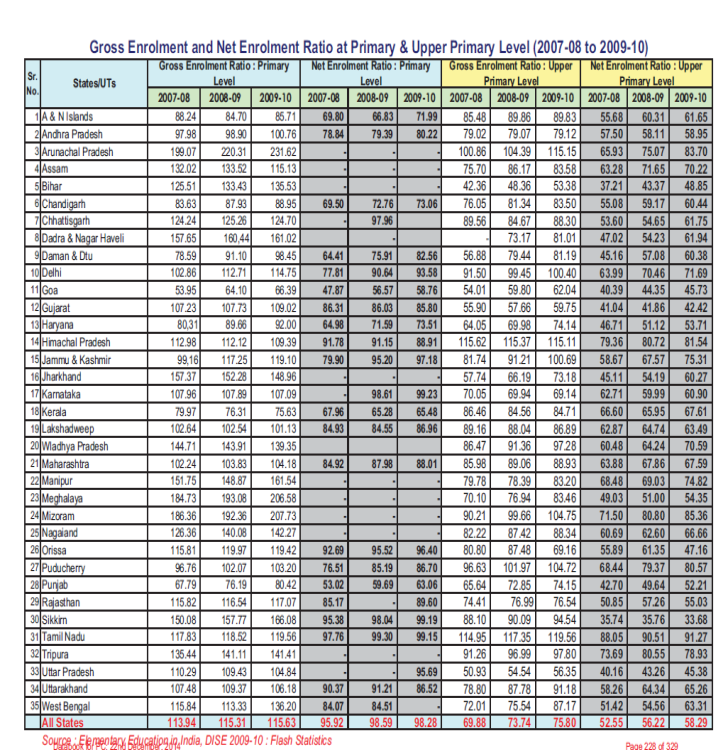
Chart-2
Enrollment of Men and women in Higher Education
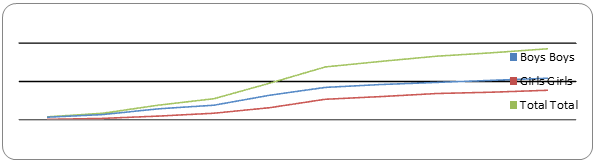
The government should plan for special education facilities for females, and special attention should give for rural females.
Women and Health
The Census report 1991, counted 407.1 female against 439.23 million male population. In 1951 the sex ratio was 946 females per thousand males. In 1991 it has declined 927 per thousand males. Table (1.2) shows the declining trend in sex-ratio.
Sex – Ratio
Table: 1.3
|
Year |
Female per thousand males |
|
1951 |
946 |
|
1961 |
941 |
|
1971 |
930 |
|
1981 |
934 |
|
1991 |
927 |
|
2001 |
933 |
|
2011 (P) |
940 |
Source: Census of India 2011(P).
The main reason of this declining sex-ratio is high mortality rate among female in all age groups. Limited access of health-care and malnutrition and under nutrition is the main cause of girls mortality. Whereas in women early motherhood is seen as the main cause. Mortality indicators show that up to the age of 35 years more females then males die at any age level. Maternal mortality rate in India is unacceptably high. The table 1.4 shows the state wise infant mortality rate by sex and residence (Per l000 live birth).
Table 1.4
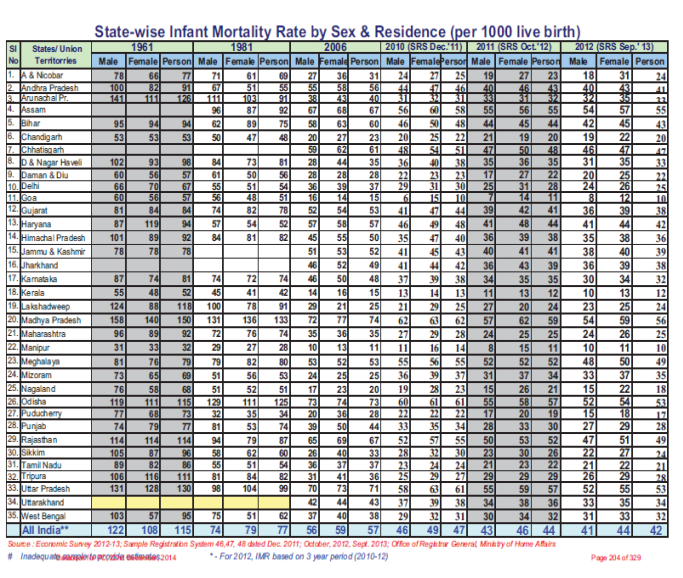
As girls, they get less vaccination, less education and less nutrition than their brothers. An alarming number of women also die in child birth. India, which accounts for 15 percent of the world’s population, is responsible for almost 25 percent of the world’s Bank. An Indian omen is 100 times more likely to die during or after child birth then a woman in west. In the table shows that the major communicable diseases are making distractions in the women’s health conditions. Diphtheria, Respiratory infection, tuber classis and cancer etc are severely affected by the male members in the country. So, the government should ensure the minimum medical facilities for Indian women’s. There are 11070320 women are suffering from acute respiratory infection and 252039 women’s are suffering from Tuber culosis. The Government should ensure the special investment programmes to solve this problem.
Table: 1.5
Reported cases and deaths due to communicable diseases in India – 2004 Female
|
Diseases |
Cases |
Deaths |
|
Diphtheria |
3625 |
59 |
|
Acute Polio myelitics |
83 |
2 |
|
Tetanus neonatal |
405 |
33 |
|
Whooping cough |
13439 |
74 |
|
Acute Respiratory infection |
11070320 |
1550 |
|
Enteric fever |
239405 |
328 |
|
Viral hepatitis |
73467 |
481 |
|
Pulmonary tuberculosis |
252039 |
2430 |
|
Pneumonia |
261617 |
1341 |
|
Syphilis |
23753 |
13 |
|
Gonococcal infection |
98242 |
81 |
Source: Health statistics of India – 2004
The impact of special intervention has reduced the death rate for both sexes. But there is a need of social awareness regarding female health status. Everyone should think that the women is the pivot of the family, hence special attention must be paid from early childhood, if we all want a healthy family, healthy society and a healthy nation. The high maternal mortality rate points to the urgent need of providing proper clinics and increasing the number of trained practioners whose presence, even in remote areas poorly served by medical fertilities, can often mean the difference between life and death for a mother and her new born child. This is essentially a task the government will have to discharge.
Focus on Women Empowerment through Five-Year Plans
The first five year plan (1951 – 56) envisaged welfare measures for women. To spearhead welfare measures the central social welfare board ( CSWB) was established in 1953, which symbolized the welfare approach to women’s problems, the rural women came within the purview of the CD programmes, they were not specifically catered to as a target population based on economic or other specific class related criteria. A large majority of poor rural women thus remain untouched.
The Second five-year plan (1956-61) was closely linked with the overall approach of intensive agricultural development. The welfare approach to women’s issues persisted.
The Third five-year plan (1961-66) pinpointed female education as a major welfare strategy. In Social welfare, the largest share was provided for expanding rural welfare services and condensed courses of education.
The fourth five-year plan (1969-74) continued the emphasis on women’s education. The basic policy was to promote women’s welfare within the family as the base of operation. The outlay on family planning was stepped up to reduce the birth rate from 40 to 25 per thousand through mass education.
The Fifth five-year plan (1974-79) emphasized the need to train women in income and protection. It also recommended a programme of functional literacy to equip women with skills and knowledge to perform the functions of a house wife.
The Sixth five-year plan (1980-1985) a chapter entitled “Women and Development” was included by adopting family as a unit of development and for this a multi-disciplinary approach with a three pronged thrust on health, education and employment was undertaken.
Seventh five-year plan (1985 – 1990) emphasized the continuation of development programme for women with the objective to raise their economic and social status and to bring them in the main stream of national development through identification and promotion of beneficiary oriented programmes.
Eighth five-year plan (1992-1997) the women were made to function as equal partners and participants in development process, shifting from development approach to empowerment of women.
According to Ninth five - year plan ( 1997-2002) “ Empowerment of women, being on e of the objectives of the ninth plans it will ensure to create enabling environment with requisite policies and programmes, legislative support, exclusive institutional mechanisms at various level and adequate financial and manpower resources to achieve this objective”.
As per the Tenth Plan Period (2002-2007) In particular, the intra-household disadvantages faced by women and children need to be recognized and redressed. It is proposed that during the Tenth Plan, the following measures be taken: National Plan of Action to operationalize the Women’s Empowerment Policy; National Policy and Charter for Children; National Commission for Children to ensure protection of their rights; National Nutrition Mission. In pursuance of the avowed objective of empowering the women as agents of socio-economic change, the National Policy on Empowerment of Women was adopted in April, 2001. On this basis, the National Plan of Action is being implemented.
During the Eleventh Plan (2007-2012) "Women are significant contributors to the growing economy and children are assets of the future. Almost 50% of our population today comprises women while 42% is under the age of 18. For growth to be truly inclusive, we have to ensure their protection, wellbeing, development, empowerment and participation. The vision of the Eleventh Five Year Plan is to end the multifaceted exclusions and discriminations faced by women and children; to ensure that every woman and child in the country is able to develop her full potential and share the benefits of economic growth and prosperity. Success will depend on our ability to adopt a participatory approach that empowers women and children and makes them partners in their own development.
Conclusion and Recommendations
Economic development is based on human resources developed. In human resources the contribution of female member is very high. The government should frame the policy in such a manner which is directly provides the assistance to the female members in the society. The following are the policy suggestion and the government should concentrate on this way to empower the women’s of India.
(i) Creating an environment through positive economic and social policies for full development of women to enable them to realize their full potential.
(ii) Equal access to participation and decision making of women in social, political and economical life of the women.
(iii) Strengthening legal systems aimed at elimination of all forms of discrimination against women.
(iv) Equal access to women to health care, quality education at all levels, career and vocational guidance, employment, equal remuneration, occupational health and safety, social security and public office etc.
References
1) ‘Women and social transformation ‘- M.G. Chitkala, A.P.H. Publishing Corporation, New Delhi-110 002.
2) ‘Women & Development’- The Indian Experience –miraseth, Sage Publications, New Delhi – 110 048.
3) ‘Women in India”- Same issue, Mridula Bhadauria, A.P.H. Publishing Corporation, New Delhi-110 002.
4) ‘Women in India’-Farhat Jahan, Annol Publications Pvt, Ltd, New Delhi-110 002.
5) ‘Women through ages’ Dr. S. Ram, Common Wealth Publishers, New Delhi-110
6) Kalpagam, U Changing status of women in India – Sage Publications, New Delhi – 110 048.
7) Narayana Reddy G and Suma Narayana Reddy-Women and chi ld Development (Serve Contemporary issues) Chugh Publications, Allahabad.
8) Health statistics of India – 2004.
9) Indian Economic Survey – 2004.
Journals:
1. Khairiah Mokhta – IOSR Journal of Humanities and Social Science IOSRJHSS- 2012
http://iosrjournals.org/iosr-jbm/papers/Vol17-issue4/Version-1/B017411319.pdf
2. http://www.unesco.org/education/pdf/283_102.pdf
@irssh.com/ Peopletold.com
3. http://www.irssh.com/yahoo_site_admin/assets/docs/14_IRSSH-490V5N1.161113256.pdf
Economic empowerment of Indian women: An analysis
Ms. Adwitiya Gope
Assistant Professor
Department of Science & Humanities
Tripura Institute of Technology
Tripura, India
&
Mr. Arjun Gope
Assistant Professor
Deptt. Of Commerce
Iswar Chandra Vidyasagar College
Tripura, India
The aim of this paper was to explore women’s economic empowerment in relation to work force participation, wage inequality and advancement in different prestigious jobs. The scenario of economic empowerment of women in India is very frustrating in comparison to all the BRICS countries as India is lagging far behind.
In case of economic participation and opportunity Indian women lag much behind by male labour force in respect to - workforce participation, remuneration and job status. The analysis gives evidence of a decline in female employment primarily in rural India , while in urban India the magnitude of decline was not that much significant. One of the main findings of the whole study is that though gender employment disparity is found across India but the highest gap is persisting in the state of Bihar where the illiteracy rate is highest in the country.
Key Words: Economic, Empowerment, Women and Participation
1. Introduction
The
word empowerment is sourced from power and it is vested where it does not exist
or exist inadequately. According to Khanday et. al. (2015), Empowerment of
women would mean equipping women to be educated, economically independent,
having good health, self-reliant, and having positive esteem to enable them to
face any difficult situation and they should be able to participate in
development activities. Despite rapid economic growth, in most of the countries, gender
disparities in economic participation of women have remained persistent problem
for a long period of time. World Economic Forum (WEF)
measures the inequality that persists between female and male in selected
countries on the basis of economic participation and opportunity, educational
attainment, health and survival and political empowerment every year. India is
ranked 108th in terms of gender-gap disparity among 145 countries
across the globe in the year 2015. The study explores how economic factor
contributes to the lower score of gender-gap disparity in India. Finally the
study finds that female economic condition has not yet been remarkable in India
mainly due to less female labour force participation.
2. Review of literature
Stine and Karina (2003) explain that empowerment is the gain of power to control their lives and the ability to make strategic life choices. According to Chung et. al. (2013), five dimensions of women empowerment is economic contribution, education, government, health, and media. Mokta (2014) opines that the process of empowerment has five dimensions, viz. Cognitive, Psychological, economic, political and physical.
Parveen & Leonhauser (2004) commented that empowerment of women is conditioned by socio-economic dimension, familial dimension and psychological dimension. According to world bank report-2012, ensuring women equal access to financial and development opportunities empowers women, expedites progress toward gender equality, and can translate into improved national and international economic efficiency.
Upadhye & Madan (2012) expressed that power over economic resources and participation in decision-making is making women more confident and that is women empowerment in true sense. Duflo (2011) stated that the labour market situation of women is such that generally women are less prone to working; they are remunerated less than men even if they do similar work and are likely to experience poverty despite their working status. According to Williams, (2005) the ability to measure gender and women’s empowerment quantitatively gives demographers a better way to study their impact on demographic processes. Baro & Sarania (2014) found that the World Bank has given emphasis on gender mainstreaming in development assistance that identifies both gender equality and women empowerment as a major development objectives and means to promote growth, reduce poverty and support better governance. "There is no substitute to women empowerment if we have to bring social equality in the country. If women are unhappy, individual homes, society and the nation will not prosper," said former President of India Pratibha Patil (2012).
3. Objectives of the study
The objectives of our study are:
(i) To identify the level of economic disparity between female and male in India in comparison to the BRICS countries;
(ii) To anlyse how far Indian women are lagging behind in terms of work force participation, wages equality and advancement in job status;
(iii) How far empowerment of women is affected due to lower rate work force participation, wage inequality and advancement in different prestigious jobs.
4. Research methodology
The methodology encompasses an analysis of secondary data, published in different sources, especially, World Economic Forum (WEF), National Sample Survey Organization and data from World Bank website. To analyse the data tables, graphs and charts are used.
5. Analysis of the Study
According to World Economic Forum (WEF) India has improved the gender-gap disparity a lot in the field of political empowerment in comparison to many other countries. In the field of Health and survival India is lagging much behind where it ranks143rd, only preceded by Armenia and China among the selected 145 countries.
Exhibit 1: Global ranking of Gender Gap: BRICS Countries
|
BRICS Countries |
Educational Attainment |
Economic Participation and Opportunity |
Health and Survival |
Political Empowerment |
Overall Global Rank |
|
Brazil |
01 |
89 |
01 |
89 |
85 |
|
Russia Federation |
27 |
42 |
42 |
128 |
75 |
|
India |
125 |
139 |
143 |
9 |
108 |
|
China |
83 |
81 |
145 |
73 |
91 |
|
South Africa |
85 |
72 |
01 |
14 |
17 |
Source: Compiled from Global Gender gap report-2015; World Economic Forum.
India ranks 139th for economic participation and opportunity gender gap which certainly shows the lower level of economic empowerment of women in India. From the gender gap score (Exhibit-2), which measures the female male ratio inside the country, it is observed
Exhibit 2: Gender Gap Score in India
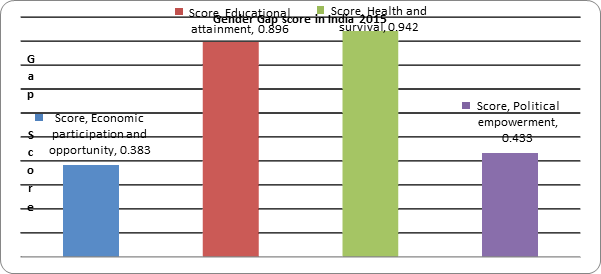 Source:
Compiled from Global Gender gap report-2015; World Economic Forum.
Source:
Compiled from Global Gender gap report-2015; World Economic Forum.
that the highest inequality persists in the area of economic participation and opportunity (0.383).
In spite of a cold draft of economic uncertainty which is sweeping across the world, the annual GDP growth of India tends to be higher than the other BRICS countries (World Bank 2014: Brazil: 0.1; Russia: 0.6; India: 7.3; China: 7.3 and South Africa: 1.5). But the economic participation and opportunity of women in India is too low among the BRICS countries. The economic participation considers the active portion of an economy's labor force. The participation rate refers to the number of people who are either employed or are actively looking for jobs. The number of people who are no longer actively searching for work would not be included in the participation rate. Exhibit 3 shows that gender gap score of economic participation and opportunity of India is almost half compared to other remaining BRICS countries.
Exhibit 3: Economic participation and opportunity: BRICS countries
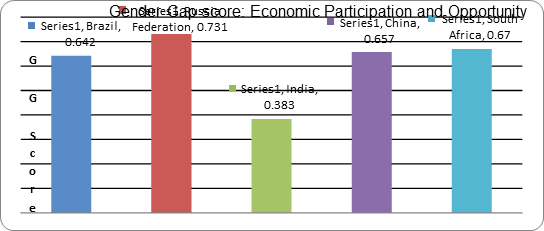
Source: Compiled from Global Gender gap report-2015; World Economic Forum.
According to World Economic Forum (2015), the sub index of Economic participation and opportunity gap contains three concepts (i) the participation gap, (ii) the remuneration gap and (iii) the advancement gap.
5.1 The participation gap:
The participation gap is measured using the difference between women and men in labour force participation rates. Female participation of India has dropped over the past decade in contrast to other emerging markets. In India, the trend of female work force participation (Exhibit 4) is decreasing and for last three years the rate has climbed down to 27% which was 37% in the year 2005. On the other China holds the highest female participation rate among the BRICS countries and it moves within the range of 64% to 66%.
Exhibit 4: Female labour force participation in BRICS countries
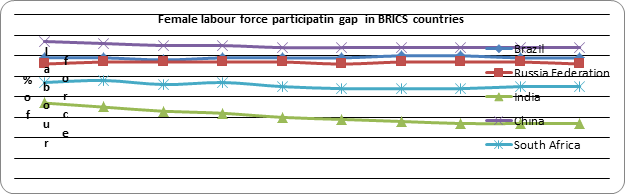
Source: Compiled from the website of World Bank
This continuous reduction in labour force participation reduces the labour force participation gap score and increases the gap between male and female in India which directly affects economic empowerment of women.
It is observed that (Exhibit-5) the work force participation gap score is 0.35 in India which means that only 350 female persons are working against per 1000 male persons in 2015. But in case of Russia Federation 870 female persons are working against per 1000 male persons in 2015. In case of labour force participation, except India, the female-to-male ratio exceeds 65% in all BRICS countries which imply women belonging to those countries are economically more empowered than India.
Exhibit-5: Work force participation gap
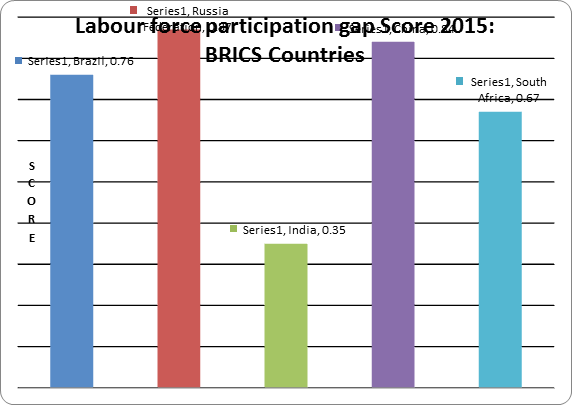
Source: Compiled from Global Gender gap report-2015; World Economic Forum.
Although the Female labor force participation rate remains more or less constant in the urban areas but this is declining in rural area. The rural female labor force participation rate was higher than the urban female labor force participation rate up to 204-05. But gap between the rural and urban in terms of female labor force participation is reducing gradually because of rapid decline of rural labour force participation and consistently low labour force participation in urban areas (Exhibit-6). Thus the trend indicates that labour force participation needs a special care to improve the economic empowerment of Indian women in both urban and rural areas and thus reduce gender gap to the extent possible.
Exhibit 6: Female labor force participation is declining in rural area and has been consistently low in urban areas
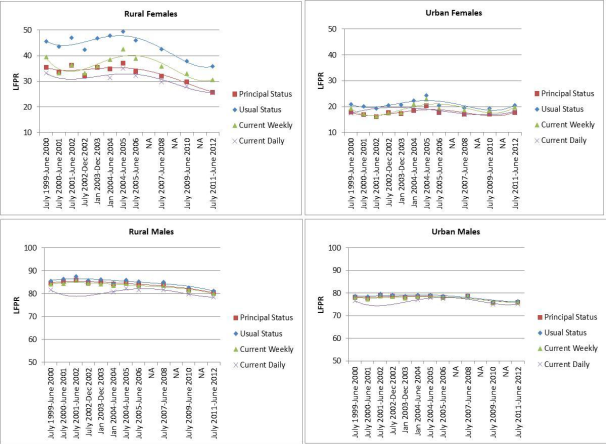
Source: Policy research working papers 7412 ; 2015; World Bank Group
Again this labour force participation score is not equally distributed among all the states and territories in the country. More than half of the states and territories score less than the national score of 0.35 calculated by WEF. From the exhibit-7, it is observed that employment gender gap score is highest in Sikkim followed by Himachal Pradesh and Meghalaya. The lowest score is obtained by Bihar, preceded by Daman & Diu and Punjab respectively.
Exhibit-7: Gender Gap employment Score in States and Territories of India:
|
States and Territories |
Female |
Male |
Gender Gap Score |
Rank |
|
Sikkim |
645 |
832 |
0.775 |
1 |
|
Himachal Pradesh |
590 |
785 |
0.752 |
2 |
|
Meghalaya |
531 |
777 |
0.683 |
3 |
|
Chhattisgarh |
509 |
833 |
0.611 |
4 |
|
Andhra Pradesh |
464 |
828 |
0.56 |
5 |
|
Mizoram |
463 |
829 |
0.559 |
6 |
|
Arunachal Pradesh |
383 |
734 |
0.521 |
7 |
|
Maharashtra |
337 |
805 |
0.419 |
8 |
|
Karnataka |
335 |
833 |
0.402 |
9 |
|
Rajasthan |
309 |
777 |
0.398 |
10 |
|
A & N Islands |
340 |
857 |
0.396 |
11 |
|
Nagaland |
302 |
779 |
0.388 |
12 |
|
Uttarakhand |
285 |
755 |
0.377 |
13 |
|
Kerala |
297 |
815 |
0.364 |
14 |
|
Goa |
274 |
795 |
0.345 |
15 |
|
Tripura |
273 |
860 |
0.317 |
16 |
|
Tamil Nadu |
263 |
843 |
0.312 |
17 |
|
Madhya Pradesh |
256 |
826 |
0.31 |
18 |
|
Manipur |
234 |
771 |
0.304 |
19 |
|
Puducherry |
231 |
787 |
0.294 |
20 |
|
Gujrat |
251 |
866 |
0.29 |
21 |
|
Dadra & Nagar Haveli |
208 |
806 |
0.258 |
22 |
|
Lakshadweep |
209 |
839 |
0.249 |
23 |
|
Odisha |
210 |
893 |
0.235 |
24 |
|
Chandigarh |
173 |
838 |
0.206 |
25 |
|
West Bengal |
170 |
862 |
0.197 |
26 |
|
Delhi |
151 |
792 |
0.191 |
27 |
|
Jharkhand |
140 |
834 |
0.168 |
28 |
|
Uttar Pradesh |
132 |
803 |
0.164 |
29 |
|
Assam |
131 |
852 |
0.154 |
30 |
|
Haryana |
104 |
779 |
0.134 |
31 |
|
Jammu & Kashmir |
97 |
759 |
0.128 |
32 |
|
Punjab |
98 |
823 |
0.112 |
33 |
|
Daman & Diu |
88 |
925 |
0.095 |
34 |
|
Bihar |
56 |
778 |
0.072 |
35 |
Source: Authors compiled from key indicators of employment and unemployment in India; NSS 68th Round
5.2 The remuneration gap:
The remuneration gap is assessed through the ratio of estimated female-to-male earned income and a qualitative indicator gathered through the World Economic Forum’s executive opinion survey on wage equality for similar work.
Reward for employment in form of pay, salary, wages including allowances, bonus and other benefits is termed as remuneration. The gender remuneration gap is the output of wages equality gap and earned income gap. Wages equality gap of India is 0.51 (Exhibit-7) which means a woman gets Rs. 49 less in every Rs. 100 than a male labour force. Although among the BRICS countries India precedes Brazil in this regard but it is mention worthy that India’s position is much lowered compared to others. The gender pay gap is conditioned by a number of interrelated family and societal factors. Women’s work space is stereotyped, it’s been dictated the kind of work women and men ‘should’ do, and the way women and men ‘should’ engage in the workforce.
Exhibit-7: Gender wages equality Gap Score
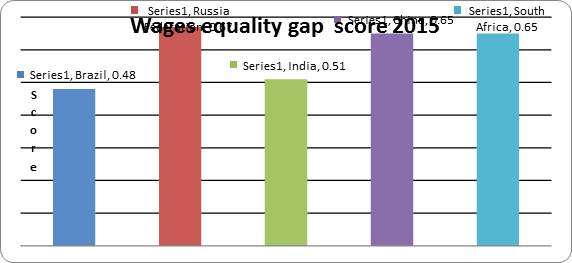
Source: Compiled from Global Gender gap report-2015; World Economic Forum.
The other part of the total remuneration gap is earned income gap between female and male. This score is the lowest in case of India. The low earned income gap score shows how far Indian women are lagging behind Indian male labour force. Among the BRICS countries no country’s earned income gap score is below 59% but India.
Exhibit-8: Earned income gap score:
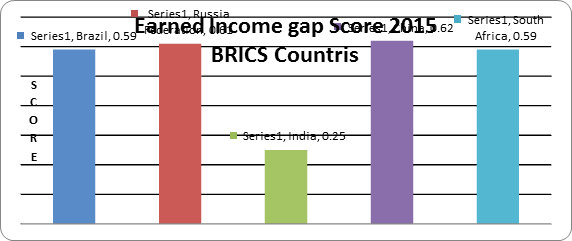
Source: Compiled from Global Gender gap report-2015; World Economic Forum.
According to Fields (1975) the conventional segmented market theory explains this stylized fact by postulating that labor informality is nothing but a survivalist alternative for those disadvantaged or rationed out of formal employment opportunities.
(iii) The advancement gap
Finally, the gap between the advancement of women and men is assessed through the ratio of women to men among legislators, senior officials and managers, and the ratio of women to men among technical and professional workers by WEF, 2015.
Legislators, senior officials and managers gap score is also surprising in case of India and China; India scores 0.24 and China scores 0.20. The score in case of Russia Federation is more than 60%. The advancement score shows the real statistics of participation of Indian women in elite posts.
Exhibit -9: Legislators, senior officials and managers gap score
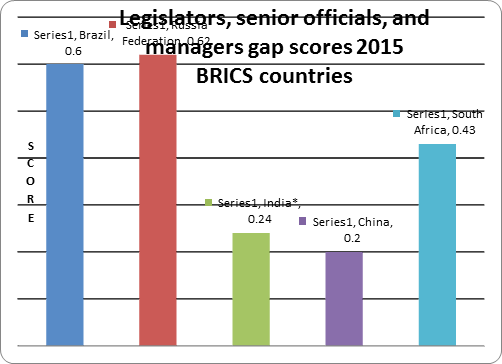
Source: Compiled from Global Gender gap report-2015; World Economic Forum.
6. Conclusion
The aim of this paper was to explore women’s economic empowerment in relation to work force participation, wage inequality and advancement in different prestigious jobs. The scenario of economic empowerment of women in India is very frustrating in comparison to all the BRICS countries as India is lagging far behind.
In case of economic participation and opportunity Indian women lag much behind by male labour force in respect to - workforce participation, remuneration and job status. The analysis gives evidence of a decline in female employment primarily in rural India , while in urban India the magnitude of decline was not that much significant. One of the main findings of the whole study is that though gender employment disparity is found across India but the highest gap is persisting in the state of Bihar where the illiteracy rate is highest in the country.
According to Basu and Maertens (2009), labor regulations are highly associated with female entrepreneurship. Nevertheless we need to take care of the societal infrastructure accessible by women in general and the mindset of every individual in particular. Parveen & Leonhauser (2004) opined that women are usually not permitted to interact with men other than their direct close family members and as a result, they have only limited access to development personnel.
Economic growth and development depend upon successful utilization of the entire workforce, both male and female. Despite its recent economic advances, India’s gender balance in economic participation and entrepreneurship remains among the lowest in BRICS countries.
According to David Knoke (1990), to achieve genuine empowerment, women of India have to swim upstream so as to be able to defeat the traditional forces of logo centrism of the norm-based society. Since each one of them is a vital agent, they have to remember "all dyadic relations of a given type”.
References
Basu, K., and A. Maertens. 2009. “The Growth of Industry and Services in South Asia and Its Impact on Employment.” In Accelerating Growth and Job Creation in South Asia, ed. E. Ghani et al. Oxford University Press.
Chatterjee, U., Murgai. R., Rama, M. (September, 2015) Job Opportunities along the Rural-Urban Gradation and Female Labor Force Participation in India. Policy Research Working Paper 7412. World Bank Group, Poverty Global Practice Group & Office of the Chief Economist,South Asia Region.
Chung, B., Kantachote, K., Mallick, A., Polster, R., Roets, B. (2013). Indicators of Women’s Empowerment in Developing Nations. Workshop in International Public Affairs. Robert M. La Follette, School of public Affair; University of Wisconsin-Madison.
David, Knoke.(1990) Political Networks: The Structural Perspective, Cambridge.
Duflo, E. (2011). ‘Women’s employment and economic development,’ National Bureau of Economic Research. Retrieved 29th December
2013. http://www.nber.org/papers/w17702
Fields, G. S. (1975). “Rural-Urban Migration, Urban Unemployment and Underemployment, and
Job-Search Activity in LDC’s”, Journal of Development Economics, 2, 165–187.
Khanday, M. I., Shah, B. A., Mir, P. A., & Rasool, P. (2015). Empowerment of Women in India- Historical Perspective. European Academic Research , 2 (2), 14494-14505.
Key indicators of Employment and Unemployment in India. NSS 68th round. 2013. NSSO. Available at : http://mospi.nic.in/Mospi_New/upload/KI-68th-E&U-PDF.pdf Accessed on: 22/05/2016
Mokta, M. (2014). Empowerment of women in India. Indian Journal Of Public Administration , 60 (3), 473-488.
Parveen, S., & Leonhäuser, I. U. (2004). Empowerment of Rural Women in Bangladesh: A Household Level Analysis. Conference on Rural Poverty Reduction through Research for Development and Transformation (5-7 October 2004), 1-10.
Patil, P. P. (2012). Speech on Eve of Republic Day , Avail able at : http://www.ibtimes.co.in/president-pratibha-patils-speech-on-eve-of-republic-day-287807, Accessed on; 10/06/2016
Porter, E. (2013.). Rethinking Women's Empowerment. Journal of Peacebuilding & Development , 8 (1), 1-14.
Shyamsunder, A., Pollack, A., Travis, D.(2015) "India Inc: From Intention to Impact" . Available at: http://www.catalyst.org/system/files/india_inc._from_intention_to_impact.pdf; Accessed on: 10/06/2016
Stine Ankerbo & Karina Hoyda; Education as a Means to Women’s Empowerment,(2003) Approaches to
Development (U-landslære), Aarhus University
The Global Gender Gap Report 2015, World Economic Forum. Available at: https://www.weforum.org/reports/global-gender-gap-report-2015/; Accessed on: 25/05/2016
Upadhye, J., & Madan, A. (2012). Entrepreneurship and Women Empowerment: Evidence from Pune. International Conference on Economics, Business and Marketing Management , 29, 192-197.
Williams,J. (2005). Measuring Gender and Women’s Empowerment Using Confirmatory Factor Analysis, Working paper, Population Program, Institute of Behavioral Science, University of Colorado, Boulder
World Bank. 2012. Gender Equality and Development: World Development Report. Washington, DC.
World Bank. 2012. “Indicators: Gender.” http://data.worldbank.org/indicator.
Websites:
http://data.worldbank.org/indicator/SL.TLF.CACT.FE.ZS ,; Accessed on 12/06/2016
FEMVERTISING: AN INNOVATIVE WAY OF WOMEN EMPOWERMENT
Puja Thapa
Guest Lecturer, BBA Department, Holy Cross College, Agartala.
Abstract
In modern business world, no business can survive without advertisement. Advertisement became a part and parcel of the commercial life. The importance of advertisement is widely recognized. But the recent challenges faced by the business world is how to advertise how to to change the thinking pattern (or buying behaviour) of the recipient, so that he or she is persuaded to take the action desired by the advertiser. To overcome with that situation many companies using the soft marketing tactic engaging women and girls online with brands, in the guise of an equality project. Over the last year, the advertising industry has been churning out more and more adverts that use pro-female talent, messages and imagery to empower women of all ages. Brands have started to sell empowerment to women through their campaigns, promoting products as trending subjects in the social conversation. This paper gives an overview of effectiveness of femvertising to empower the women of this era.
Keywords: Advertisement, Femvertising, Women empowerment, Pro-female talent.
Introduction
According to the word of youngest Nobal price winner Malala Yousafzai, “We have to change this idea that women are only supposed to work in the house.... Women should go out and be what they want”. This short and simple message speaks about the most sensitive issues of this era and that is Women Empowerment.
Women constitute almost 50% of the world’s population. As per their social status women are not treated as equal to men in many places. The disabilities on the one hand and the inequalities between men and women on the other have given rise to what is known as ‘gender problem’. During the recent years gender issue has become virtually a crucial point of argument. It is now widely believed that women empowerment that is providing equal rights, opportunities and responsibilities to women will go a long way in removing the existing gender discrimination. Women empowerment in contemporary Indian society in forms of their work, education, health and media images, in the context of lineage, the rule of residence and household chores, their participation in social and political activities, their legal status in terms of marriage, divorce and inheritance of property, should be taken into consideration.
In 2008, the UN Secretary-General launched the UNiTE to End Violence against Women campaign with the aim to raise public awareness and increase political will and resources for preventing and ending all forms of violence against women and girls in all parts of the world. With the advent of the concept of gender equality it has been observed from the table mentioned below that the rate of literacy among women has increased from 53.6% in the year 2001-02 to 64.6% in the year 2010-11.
Fig 1: The female Literacy rate in India
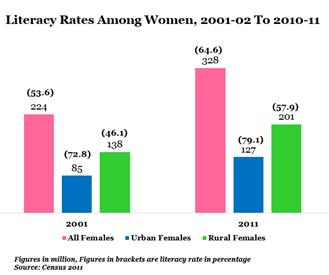
Fig 2: Dual Income Household
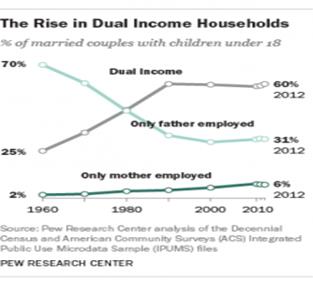
With the increasing rate of literacy rate among female, the percentage of dual income household also increased. The percentage of dual income means both husband and wife working together increase from 25% in the year 1960 to 60% in the year 2010. And the percentage of family where only mother working also rose from 2% to 6%. This statistics is a clear indicator that the women are financially becoming more capable. The rise of dual income helps the marketer to promote more products using pro-female talent in advertisement.
Objective of the Study:
o To study the role of women in advertisement
o To study the role of Fem-vertising for promoting women empowerment.
o To study the prospect of fem-vertising to empower women in our society.
Methodology:
The study is purely based on secondary data. The data has been collected from various articles, web source and different websites. Both qualitative and quantitative analysis was done and data were represented graphically.
Meaning of Fem-advertising:
It defined as advertising that employs pro-female talent, messages, and imagery to empower women and girls. It's the latest wave in advertising, and it's working. Female-friendly campaigns are outperforming ads that perpetuate overused or passé stereotypes.
Fem-vertising is a fairly new marketing buzzword used to describe inspiring campaigns championing girls and women around the world. It also refers to the kind of campaigns promoting real women and challenging gender stereotypes. Dove first come up with the idea and launched a pro-female campaign in 2004.
Role of women in advertisement:
The roles of women have greatly domesticated in popular culture, especially in advertisements. Many advertisements contain women in roles such as cooks, maids, babysitters, as well as sex objects in order to sell product. In the beginning, advertisements were once shown to sell a product, however, as years pass, advertisements begin to objectify women and begin to use women as a way to sell products. Looking at the trends of advertisements, women continue to be one of main objects for a product. The trends have greatly changed, now advertisers have been finding different ways to feature women in ads in order to entice buyers. And, it would seem, the strategy works.
But the way women have been portrayed in advertising has changed over the decades, and changed the way society views women because of it. From housebound drudge to sexpot to business leader, ads are constantly portraying about women's role in society.
Women, in the old times, were used in advertisements to portray delicacy and tenderness. Even in the movies, they were portrayed to be delicate and very soft by heart so they were basically included in the advertisement of brands of washing powders, talcum powders etc. For example, Nirma, a famous Indian brand of washing powder, has been including only women in their advertisements since its advent, as in India an ideal women is considered to do all household work, including washing clothes.
With time, home-makers i.e. women started being included in the advertisement of the brands of household appliances, utensils, feminine talcum powders etc. Hawkins, the brand of Indian pressure cooker has been portraying women as a mother as well as a wife in its commercials. As the food cooked by a mother is considered to be the tastiest food in Indian society, and when the mother is unable to do so, the wife gets into the role.
Today, women are not just a symbol of delicacy and tenderness; they portray sensuous as well as strong roles on the television. Women are also used to increase glamour in the advertisements. Brands like Axe and Addiction (Deodorants) include women in their commercials to make their commercials sensational and tempting. Women get attracted to the masculine fragrances in these ads, so these ads appear quite appealing to the youth.
Next, women are also seen in the ads of scooties and cars, sometimes to increase the glamour and sometimes to portray girl-power. Pleasure, an Indian scooty brand has its tagline as ‘Why should boys have all the fun!’ Here women are used to show that they are no less than men. Upon the dawn of enlightenment, women have come to play strong roles in advertisements and not just objects of desire.
In some of the recent ad like Rajnigandha paan masala, Blender pride Soda, bollywood actress Priyanka Chopra has been appointed as a brand ambassador. This is the first time in the history of Indian advertisement that a woman has been appointed to promote those brands which are considered as masculine brand. Not only this in many of the national campaign actresses become the brand ambassador for eg Atithi Devo Bhava by Priyanka Chopra, National Sanitation Campaign by Vidya Balan, Mamta abhiyan and beti bachao beti padhao by Madhuri Dixit.
Pro-female ads in India:
The trend of portraying female talent in advertisement is not a very new concept. Earlier the women used to treat as a medium to sell product in the market and now they are portraying as an empowered women. Even though the ad agencies portraying housewives as an intelligent wife or mother.
The woman in the Airtel Boss advertisement performs a dual role, one of a boss at office and the other of a caring wife at home. The highpoint of the advertisement is that she and the man who is her subordinate at work are actually a couple. Too often, male power or masculinity is highlighted in advertisements but portrayal of the empowered woman in this commercial is significant.

Image 1: the Airtel advertisements
In the Bournvita commercial, the woman is shown taking an active part in grooming and preparing her son to face struggles in life and emerge victorious. She takes charge of grooming her child to be capable enough to face any difficulty, be it professional or personal. It brings home to viewers the fact that a woman is not meant to only nurture her child within the four walls of her home and make his meals.

Image 2: Bournvita advertisement
The Raymonds advertisement depicts the reversal of gender roles, where the man stays back at home to look after the infant and persuades his wife to go to her place of work. This advertisement has attempted to break the typical assumption that the responsibility of looking after the children and homes rests solely with women. It highlights that men have an equal responsibility in rearing children.

Image 3: Raymond advertisement
Then there is the Bharat Matrimony commercial where the man is shown respecting the capabilities of the woman and encouraging her to pursue her professional life. The support he gives her, against the backdrop of an arranged marriage, to pursue her job in spite of opposition from her in–laws, is significant.

Image 4: the Matromony advertisement
The latest ad of Tanishq jewellery where three women enjoying song together wearing diamond jewellery is itself talk about women empowerment. The ad agencies are now more interested to show independent women in an ad rather than a bride wearing heavy jewellery.

Image 5: the Tanishq advertisement
Fem-Avertising in India:
2015 was a year of empowerment. All of a sudden, there was a shift in the role men were supposed to play in the society. This was the year of the alpha female and the role of the man was sidelined. She suddenly moved from the boundaries of the kitchen to behind the bosses chair; from the role of being only the homemaker to someone who was no longer confined to only the house. The Indian women made it big this year. Probably, for the first time sidelining and making the Indian male feel insecure in his territory. The success of movies like Queen and Mary Kom this year made the Indian female the centre of attention; someone who was here to redefine the rules. While the world outside was changing and noticing the rise of the one who was categorically specified as ‘abla’ a few years back, advertisers hit upon a winning formula- the female protagonist. I can almost imagine the dialogues inside the agency, once they realized that ‘culture’ demanded a script around a female oriented narrative.
Some of the well known brands are more likely to promote women empowerment through advertisement rather than telling about the core benefits of the brands. The reason behind doing such practices actually helps to serve two purposes first to create the awareness about the brand, secondly to promote the brand using the emotions of the consumers.
List of some of the brand who speaks specifically about Women empowerment:
1. Anouk Ad: it talks about the harassment which often faced by the pregnant women in a workplace and the tagline “Bold is Beautiful” undoubtedly the best tagline ever to present the work women empowerment.

Image 6: Myntra Advertisement
2. Dabur Vatika : “Brave is beautiful” this is a beautiful tagline used in the ad. This advertisements shows self-esteem and self-respect.

Image 7: Dabur Vatika Advertisement
3. Vague magazine: “Boys don’t cry” and “it’s my choice” are some of the powerful tag line used in this ad to give lesson to break stereotype thinking for the women.

Image 8: Vogue “boys don’t cry Advertisement

Image 9: Vogue “its my choice ad”
4. Dove: it’s always focuses on the beauty of women. It was started a campaign “Real Beauty”

Image 10: Dove advertisement
Role of women in purchasing decision making process:
The urban Indian woman who earned Rs 4,492 per month in 2001 was taking home as much as Rs 9,457 as of 2010. The rise in her income is directly reflected in the average monthly household income of urban India going up from Rs 8,242 to Rs 16,509 in 2010, says the IMRB survey. Due to the rise of income among the women, the advertisers try to attract the female member of the family more. Most of the products like Deodorants, durable items, grocery items, baby products, vehicles etc are now trying to grasp the attention of more women consumers.
According to Kishore Biyani, founder, Future Group, the contribution of women's wear to overall sales more than double from 22% when it started operations to 55% currently. This clearly shows that the potentiality women buyers are huge and increasing.
Brand experts say the changes over the last decade where more of the buying power is moving into the hands of woman has led to her influence in purchases even in categories predominantly of male consumption. "There remain very few areas of consumption in which the female does not increasingly participate today. Most household purchase decisions are either joint or exclusively female. Like in the West, marketing approaches and brand experiences in India will increasingly need to be designed around these insights," said Tanya Dubash, executive director & president marketing, Godrej Industries.
And this trend is reflected in the survey which says while 34% of women participated in the actual buying process in 2003, by 2010 that number had gone up to 43%. "Is the recent explosion in male grooming only because of male consumers or is it also triggered by the subtle influence and desire of the female to have her man well groomed?" asked Dubash.
Changing pattern of advertisement:
|
Sl.no |
Brand |
Old ad |
New ad |
Explanation |
|
1. |
Nirma |
|
|
The old ad spoken about the benefits of the product using a housewife as model whereas the new one represent the women of today. The lead ladies getting their hands dirty while pushing out an ambulance stuck in a pit without caring about the stains. |
|
2. |
Bournvita |
|
|
The old ad focused only on the benefits of the drink to the kids but the new ad talking about how Mother take responsibilities to groom her kid to achieve success in life with a tag line “taiyari jeet ki” |
|
3. |
Rajnigandha paan masala |
|
|
Paan masala always treated as masculine brand but to minimize the gender gap the company hired Priyanka chopra as a brand ambassador |
|
4. |
Fair and lovely |
|
|
Old one focused on fairness whereas new one focused on inspiring women to build their identity first. |
|
5. |
Bharat Matrimony |
|
|
Earlier the bride father used to search groom for her daughter and in the latest ad the bride herself selecting groom from lakh of potential aspirants. |
|
6. |
Kellogs |
|
|
Kellogs used to be a breakfast product. Earlier a mother was preparing breakfast for her child but to penetrate in the market well they lauch K programme for women and it also inspire women to look special. |
|
7. |
Dabur honey |
|
|
The old add talk about the core benefits of honey using male actors but the new one “Jealous husband” the tag line is enough to describe all the benefits of it. |
|
8. |
Titan raga |
|
|
In the old ad it has been said that no jewelries’ are required, only raga is enough for a beautiful looks. But in the new ad its talks about the women of today, and a very powerful tag line “her life her choice’ |
|
9. |
Horlicks |
|
|
Horlicks used to be a healthdrinks for kids but, it launched for women too It is a part of marketing strategy to penetrate in the market. |
Impact of pro-female advertisement:
Changes taking place after introducing pro-female ad. As per the following statistics released by SheKnows Fem-vertising survey, 2014
· Over 50% of women polled bought a product because they liked how the brand and their advertising portrays women.
· 51% of women like pro-female ads because they believe they break down gender-equality barriers.
· 81% said ads that positively portray women are important for younger generations to see.
· 71% of respondents think brands should be responsible for using advertising to promote positive messages to women and girls.
Conclusion:
For decades, advertisers have been finding different ways to feature women in ads in order to entice buyers. And, it would seem, the strategy works. When we talk about female in ad many negative thoughts comes into our mind. Many authors have spoken only negative role of women in advertisement. They speak about women exploitation in media, women shows as a show piece, women used as a sex object etc.
But the way women have been portrayed in advertising has changed over the decades, and changed the way society views women because of it. In most of the advertisement of recent times, a women is projected as confident, independent, extrovert, dominant and having go getting attitude rather than just portraying them stereotypically as being a homemaker wearing saree washing clothes, utensils, cooking, taking care of family member etc.
Off late but media has realized that women is the most respectable personality in India than in any other country and the way they are projected in recent ads is different and it signals her independence and her desire to be self-sufficient. The ads are representing the “women of today”.
The advertisements, which stress on the ‘achiever’ facet of women, create an impact on society – they inspire as well as empower. This is a welcome change, a fresh breath of air. Women are no more treated as Object they are Prospect.
References:
http://www.acrwebsite.org/volumes/9532/volumes/v06/NA-06
http://www.businessinsider.com/18-ads-that-changed-the-way-we-think-about-women-2012-10?IR=T
http://www.adageindia.in/marketing/news/ad-ages-women-to-watch-2015/articleshow/47500803.cms
http://www.youthkiawaaz.com/2015/12/best-and-worst-indian-ads-of-2015/
http://marketingbuzzar.com/2015/12/2-the-rise-of-femvertising/
http://timesofindia.indiatimes.com/topic/fem-vertising
http://fortune.com/2015/07/20/femvertising-awards-feminist-ads/
http://worcuga.com/2015/02/femvertising-the-new-era-of-advertising/
HALF-WIDOWS IN JAMMU AND KASHMIR: A MAJOR VIOLATION OF HUMAN RIGHTS
Dr. Sukanta Sarkar, Sudip Bhatacharjee and Sankar Mukherjee
[Assistant Professor, Faculty of Management Studies, ICFAI University Tripura, Kamalghat]
Abstract
Half-widow is a term given to Kashmiri women whose husbands have disappeared and were still missing during the ongoing conflict in Kashmir. The basic reason for arising the half widow problem is the implementation of Armed Forces (Special Powers) Acts in Jammu and Kashmir. Nehru’s government passed the Armed Forces Special Powers Act (1958) in the Indian parliament. Very few lawmakers spoke in opposition to the law. Responding to Gendered Violence in Kashmir" by a key human rights group in the region Jammu and Kashmir Coalition of Civil Societies estimates the number of ‘half-widows’ at around 1,500. The main objectives of this paper are: (a) to study the causes of half-widow in Jammu and Kashmir, and (b) To analysis the socio-economic situation of half-widows in India
Keywords: Half-widow, Kashmir, Human Rights, & Women Rights.
Introduction
Women during the early Vedic period enjoyed equal status with men in all aspects of life. Works by ancient Indian grammarians such as Patanjali and Katyayana suggest that women were educated in the early Vedic period. Indian women's position in society further deteriorated during the medieval period, when child marriage sand a ban on remarriage by widows became part of social life in some communities in India. The Bhakti movements tried to restore women's status and questioned certain forms of oppression. Immediately following the Bhakti movements, Guru Nanak, the first Guru of Sikhs, preached equality between men and women. During the British Raj, many reformers such as Ram Mohan Roy, Ishwar Chandra Vidyasagar and Jyotirao Phule fought for the betterment of women.1
Widow is a woman whose spouse has died, while a widower is a man in that situation. Widows in India have a pronoun problem. The estimated 40 million women widows in the country go from being called “she” to “it” when they lose their husbands. They become “de-sexed” creatures.2 The political fever in Kashmir starts to rise. There is broken sentiment. Some favour Indian Kashmir being integrated with Pakistan, some favour Kashmir as an independent state. Emotions run high and the Indian Army is present everywhere. There is frequent terrifying frisking of locals to determine the people’s sentiment.3 The main objectives of this paper are: (a) to study the causes of half-widow in Jammu and Kashmir, and (b) To analysis the socio-economic situation of half-widows in India.
Who are Half Widows?
It is a term given to Kashmiri women whose husbands have disappeared and were still missing during the ongoing conflict in Kashmir. These women are called "half-widows" becau se they have no idea whether their husbands are dead or alive.4 It came up sometime during the two-and-a-half decades of conflict in Kashmir when men disappeared, mostly in the custody of security forces, leaving behind wives who had no way of knowing whether their husbands were dead or alive.
Causes of Half Widows
The basic reason for arising the half widow problem is the implementation of Armed Forces (Special Powers) Acts in Jammu and Kashmir. This Act grants the army, central police forces, and state police personnel in “disturbed areas” “certain special powers,” including the right to shoot to kill, to raid houses, and destroy any property that is “likely” to be used by insurgents, and “to arrest without warrant” even on “reasonable suspicion” a person who has committed or even “about to commit a cognizable offence.” So when arm forces arrested people and takes in camp and do not disclose the location, then their wife do not have information about their husband. Thereafter they are called as half-widow, because they do not know whether their husband is alive or die.
Armed Forces (Special Powers) Acts (AFSPA)
According to wikipedia, Armed Forces (Special Powers) Acts are Acts of the Parliament of India that grant special powers to the Indian Armed Forces in what each act terms "disturbed areas". An act passed in 1990 was applied to Jammu and Kashmir and has been in force since. The Armed Forces Special Powers Ordinance of 1942 was promulgated by the British on 15 August 1942 to suppress the Quit India Movement. Modeled on these lines, four ordinances—the Bengal Disturbed Areas (Special Powers of Armed Forces) Ordinance; the Assam Disturbed Areas (Special Powers of Armed Forces) Ordinance; the East Bengal Disturbed Areas (Special Powers of Armed Forces) Ordinance; the United provinces Disturbed Areas (Special Powers of Armed Forces) Ordinance were invoked by the central government to deal with the internal security situation in the country in 1947 which arouse out of Partition of India.
AFSPA grants the army, central police forces, and state police personnel in “disturbed areas” “certain special powers,” including the right to shoot to kill, to raid houses, and destroy any property that is “likely” to be used by insurgents, and “to arrest without warrant” even on “reasonable suspicion” a person who has committed or even “about to commit a cognizable offence.” Imposed first on the Naga Hills in 1958, AFSPA, an emergency law, was to be in force for a year. Almost six decades thereon, it remains in effect not just in these hills but in “disturbed areas” across all seven north-eastern states. Since July 1990, it has been in force in the Kashmir Valley too.5 No legal proceeding against abuse of such arbitrary powers can be initiated without the prior permission of the Central government.6
Nehru’s government passed the Armed Forces Special Powers Act (1958) in the Indian parliament. Very few lawmakers spoke in opposition to the law.7 Following widespread protests after the 2004 murder in custody of an alleged militant called Manorama Devi in Manipur, the Indian government set up a five-member committee to review the AFSPA. The review committee submitted its report on June 6, 2005, recommending repeal of the act. In April 2007, a working group on Jammu and Kashmir appointed by the prime minister also recommended that the act be revoked. However, the cabinet has not acted on these recommendations because of opposition from the armed forces.8
The powers that the AFSPA extends to the armed forces come into force once an area subject to the Act has been declared “disturbed” by the central or state government. The Indian government claims that the soldiers responsible for human rights violations have to face military courts. Under the Army Act, the military may transfer a soldier from civilian to military custody for offenses that can be tried by a court martial.9
View of United Nations
When India presented its second periodic report to the United Nations Human Rights Committee in 1991, members of the UNHRC asked numerous questions about the validity of the AFSPA. They questioned the constitutionality of the AFSPA under Indian law and asked how it could be justified in light of Article 4 of the International Covenant on Civil and Political Rights, ICCPR.
On 23 March 2009, UN Commissioner for Human Rights Navanethem Pillay asked India to repeal the AFSPA. On 31 March 2012, the UN asked India to revoke AFSPA saying it had no place in Indian democracy. A number of UN treaty bodies have pronounced it to be in violation of International Law as well.10
Opinion of Non-Governmental Organization
The act has been criticized by Human Rights Watch as a "tool of state abuse, oppression and discrimination". Many human rights organizations such as Amnesty International and the Human Rights Watch have condemned human rights abuses in Kashmir by police such as "extra-judicial executions", "disappearances", and torture; the "Armed Forces Special Powers Act", which "provides impunity for human rights abuses and fuels cycles of violence.
The Wikileaks diplomatic cables have recently disclosed that Indian government employees agree to acts of human rights violations on part of the Indian armed forces and various paramilitary forces deployed in the north east parts of India especially Manipur. Earlier leaks had also stated that International Committee of the Red Cross had reported to the United States diplomats in Delhi about the grave human rights situation in Kashmir which included the use of electrocution, beatings and sexual humiliation against hundreds of detainees.11
India’s Armed Forces Special Powers Act has been used to violate fundamental freedoms for 50 years and should be repealed, Human Rights Watch said in a report. Human Rights Watch’s 16-page report, “Getting Away with Murder: 50 years of the Armed Forces Special Powers Act,” describes how the Armed Forces Special Powers Act, or AFSPA, has become a tool of state abuse, oppression, and discrimination. The law grants the military wide powers to arrest without warrant, shoot-to-kill, and destroy property in so-called “disturbed areas.” It also protects military personnel responsible for serious crimes from prosecution, creating a pervasive culture of impunity.
The AFSPA has not only led to human rights violations, but it has allowed members of the armed forces to perpetrate abuses with impunity. They have been shielded by clauses in the AFSPA that prohibit prosecutions from being initiated without permission from the central government. Such permission is rarely granted. The Supreme Court has issued guidelines to prevent human rights violations, but these are routinely ignored. Since 2000, Irom Sharmila, an activist in Manipur, has been on hunger strike demanding repeal of the act. 12
Half-Widows in Jammu and Kashmir
Over 70,000 people, mostly civilians, have been killed in the disputed territory claimed by both India and Pakistan who rule it in two parts but claim it in entirety. In 2009, the Guinness Book of World Records declared Kashmir as the "planet’s largest militarised territorial dispute". The unresolved conflict has resulted in untold miseries, including the misfortune that befell the women whose husbands have disappeared without a trace.
The government doesn’t have a figure on Kashmir’s half-widows but a report "Half widow, Half Wife? Responding to Gendered Violence in Kashmir" by a key human rights group in the region Jammu and Kashmir Coalition of Civil Societies estimates the number of ‘half-widows’ at around 1,500.13 India denies any connection to the abductions and says fewer than 1,000 people have disappeared. It says most of the missing has gone to the Pakistan-administered side of Kashmir for training in guerrilla warfare. The Indian administration has confirmed 135 such missing persons as dead.14
The disappearances which continued unabated during 1990s created a sub group of widows who were called ‘Half widows,’ a term for women who did not know whether their husbands were dead or alive. Most of half widows were surrounded by various emotional, economic and social insecurities after their husbands went missing. But the biggest problem faced by almost every half widow was raising their children and financing their education, for which they ventured out of their homes and worked as labour, apart from doing odd jobs in factories, offices and shops.15
The crime of enforced disappearance is not legally recognised in India, and in Kashmir, cases of disappearances have been swept under the carpet under legal fictions of missing cases or as deaths. Unlike in India, there is no ambivalence in international law. Article 24 of the International Convention for the Protection of All Persons from Enforced Disappearance defines victims of the crime as both the disappeared and those who have suffered as a direct result of the disappearance. So the half-widow in Kashmir, in this sense too, is a victim of enforced disappearances.16
Let discuss one incidence: It was in 1993 when her husband Vilayat Shah, a daily wager, left home in search for work. Fatima, 65, waited for his return for ten days but he was nowhere to be found. "I searched him for months. Except for the army camps I searched for him everywhere. And one day I just gave up," Fatima says, adding, "We are illiterate people. In this far-away unreported world we do not have any information how to proceed with the case legally."17
According to a detailed 2007 report by the award winning Kashmir based journalist, Haroon Marani, the primary concern of families "is to find their missing person. They move from one police station to another, from one army camp to another and so on. It takes months and years". During the years of conflict in Kashmir, it's not only the half-widows who have suffered. As early as 1989, reports of enforced disappearances began in the Jammu Kashmir regions when a group of young men took up arms against what they term the "occupation" of the Indian government, chanting pro-freedom slogans of "Azadi"
To file a missing persons report is not easy in Srinagar. Some families, while trying to report missing family members, have faced police pressure and intimidation after giving a report. The irony is that the government relief pension payment of 100,000 rupees per year is awarded only after families obtain a death certificate from district authorities. First, they must prove that the victim was never involved in any actions that might be interpreted as political militancy.18
Effects on Half Widows
Wives of disappeared men often face various socio-economic and emotional uncertainties. Since most of the disappeared men are from rural Kashmir, these widows usually live impoverished lives. And because of religious and societal pressures, most of the half-widows don’t re-marry. The biggest dilemma faced by the half widows is that in the absence of their bread winners, they have to rely on their in-laws or parents for their economic need with their property and custody rights undetermined.
Economic relief such as ration cards or transfer of husband's property or bank accounts are also difficult to get as these processes require death certificate which of course half widows generally do not have as their husbands are officially not recognised as deceased.19 Under Islamic jurisprudence, a widow with children gets one-eighth of her husband's property. A widow without children gets one-fourth. A half-widow, till her husband is declared dead, gets nothing.20
Some half widows are also left with no options but to beg on streets. Generally, the half widow’s end up envying widows, as at least the latter one receives some form of administrative relief, even if the legal system stalls and fails. Besides the violence inflicted directly on their bodies, women also face other forms of gender violence. It’s a disturbing feeling for them; on the one hand they want to know the truth and on the other they wish not to see them dead.21
Since most of the disappeared men are from rural Kashmir, these widows usually live impoverished lives often facing various socio-economic and emotional uncertainties such as lack of property rights, right to compensation and the right to remarry. Half-widows were also present at the consultative sessions.22
Violation of Human Rights
These are the opening words of the preamble of the Indian Constitution. “We, The People of India, having solemnly resolved to constitute India into a SOVEREIGN SOCIALIST SECULAR DEMOCRATIC REPUBLIC and to secure to all its citizens:
'JUSTICE, social, economic and political;
· LIBERTY of thought, expression, belief, faith and worship;
·
EQUALITY of status and of opportunity; and to promote
among them all
FRATERNITY assuring the
dignity of the individual and the unity and integrity of the Nation.”
The idea of Liberty refers to the freedom on the activities of Indian nationals. This establishes that there are no unreasonable restrictions on Indian citizens in term of what they think their manner of expressions and the way they wish to follow up their thoughts in action. All the citizens are secured with liberty of thought, expression, belief, faith & worship through the Fundamental Rights which are justified in nature. Equality envisages that no section of the society enjoys special privileges and individuals are provided with adequate opportunities without any discrimination. Fraternity refers to a feeling of brotherhood & a sense of belonging with the country among its people. It embraces psychological as well as territorial dimensions of National Integration. AFSPA violates all those for half widows.23
The law violates India’s obligations under international human rights law, including the rights to life, to be protected from arbitrary arrest, and to be free from torture and other ill-treatment, Human Rights Watch said. The provisions protecting soldiers from prosecution deny victims of abuses the right to a remedy because it forbids prosecution of soldiers without approval from the central government, which is rarely granted.24
The right to life is violated by section 4(a) of the AFSPA, which grants the armed forces power to shoot to kill in law enforcement situations without regard to international human rights law restrictions on the use of lethal force. The right to liberty and security of person is violated by section 4(c) of the AFSPA. The right to remedy is violated by section 6 of the AFSPA, which provides officers who abuse their powers under the AFSPA with immunity from legal accountability. In practice the AFSPA also facilitates violation of the right to be free from torture.25
The government has a responsibility to ensure the protection of citizens from abuses by separatist militants and armed groups, Human Rights Watch said. However, the AFSPA has proven to be ineffective and has instead encouraged abuses by all sides.26
Widow Remarriage
With the state not acknowledging their disappearance, these women don’t figure anywhere in the Jammu and Kashmir government’s compensation scheme for people killed in the two-decade-long conflict.27 State law dictated that a woman has to wait for seven years after the disappearance of her husband to remarry. However, opinions vary due to different interpretations of Sharia law – while the Hanafi School claims 90 years after the husband’s disappearance, Maliki school scholars put the waiting period as four years and some as seven years.28 There are many cases, even after ten years, where a husband has been missing and widows haven not been able to remarry.29
Conclusion
An effective international strategy to counter terrorism should use human rights as its unifying framework. The suggestion that human rights violations are permissible in certain circumstances is wrong. The essence of human rights is that human life and dignity must not be compromised.30 International bodies have repeatedly recommended the repeal of the AFSPA. These include the United Nations Human Rights Committee and UN member states during India’s Universal Periodic Review at the Human Rights Council in 2008.31
During the years of conflict in Kashmir, it's not only the half-widows who have suffered. The half-orphans have suffered heavily under the weight of lives with little opportunity. For many half-widows, the constant dilemma of whether or not to remarry is juggled with a sense of loyalty and love for the missing husband.32 Wives of disappeared men often face various socio-economic uncertainties too. Since most of the disappeared men are from rural Kashmir, these widows usually live impoverished lives.33
References
1. https://en.wikipedia.org/wiki/Women_in_India
2. http://www.womenundersiegeproject.org/blog/entry/the-ongoing-tragedy-of-indias-widows
3. http://thekashmirwalla.com/2016/03/half-widow-a-feature-film/
4. https://en.wikipedia.org/wiki/Half-widow
5. http://thediplomat.com/2015/07/indias-controversial-armed-forces-special-powers-act/
6. https://www.quora.com/What-is-AFSPA-And-what-are-the-disadvantages-of-this-act
7. http://america.aljazeera.com/articles/2014/3/8/armed-forces-specialpowersactabriefhistory.html
8. https://www.hrw.org/news/2008/08/18/india-repeal-armed-forces-special-powers-act
9. https://www.hrw.org/legacy/backgrounder/2008/india0808/
10. Armed Forces (Special Powers) Acts, Retrieved from https://en.wikipedia.org/wiki/Armed_Forces_(Special_Powers)_Act
11. Armed Forces (Special Powers) Acts, Retrieved from https://en.wikipedia.org/wiki/Armed_Forces_(Special_Powers)_Act
12. https://www.hrw.org/news/2008/08/18/india-repeal-armed-forces-special-powers-act
13. http://www.aljazeera.com/news/asia/2013/09/dilemma-kashmir-half-widows-201392715575877378.html
14. http://womensenews.org/2007/01/kashmirs-half-widows-struggle-fuller-life/
15. http://twocircles.net/2016jan26/1453790861.html
16. http://scroll.in/article/762867/photos-the-never-ending-tragedy-of-kashmirs-half-widows
17. http://www.aljazeera.com/news/asia/2013/09/dilemma-kashmir-half-widows-201392715575877378.html
18. https://www.theguardian.com/global-development/2010/oct/11/1
21. http://www.youthkiawaaz.com/2013/12/shocking-tale-half-widows-half-orphans-enforced-disappearances-kashmir/
22. http://www.c-r.org/news-and-views/news/breakthrough-ruling-kashmir-%E2%80%98half-widows%E2%80%99
23. https://en.wikipedia.org/wiki/Preamble_to_the_Constitution_of_India
24. https://www.hrw.org/news/2011/10/19/india-repeal-armed-forces-special-powers-act
25. https://www.hrw.org/legacy/backgrounder/2008/india0808/
26. https://www.hrw.org/news/2011/10/19/india-repeal-armed-forces-special-powers-act
27. http://indianexpress.com/article/india/india-others/the-other-half/
28. http://www.c-r.org/news-and-views/news/breakthrough-ruling-kashmir-%E2%80%98half-widows%E2%80%99
29. https://womennewsnetwork.net/2010/10/07/kashmirs-half-widows-considered-only-half-in-society/
30. https://www.quora.com/What-is-AFSPA-And-what-are-the-disadvantages-of-this-act
31. https://www.hrw.org/news/2011/10/19/india-repeal-armed-forces-special-powers-act
32. http://www.theguardian.com/global-development/2010/oct/11/1
33. http://timesofindia.indiatimes.com/city/jammu/The-pain-of-Dardpora-Kashmiri-half-widows-living-in-a-state-of-limbo/articleshow/49251750.cms
ABOUT THE PUBLISHER
The Institute of Chartered Financial Analysts of India (ICFAI Society) was established in 1984 as a not-for-profit educational society in Andhra Pradesh, India. ICFAI University refers to the universities sponsored by the Institute of Chartered Financial Analysts of India and is established in the state of Uttarakhand, Tripura, Sikkim, Meghalaya, Mizoram, Nagaland, and Jharkhand under respective State legislations. The University Grants Commission (UGC) has recognized the above seven ICFAI universities established under State legislations in terms of Section 2(f) of the UGC Act 1956.
The Institute of Chartered Financial Analysts of India University, Tripura (IUT) or The ICFAI University, Tripura was established in 2004 through an Act of State Legislature (Tripura Act 8 of 2004). UGC has approved the university under Section 2(f) of the UGC Act, 1956 and hence included in the list of universities maintained by UGC under Section 2(f) of the UGC Act, 1956. The campus at Kamalghat Sadar, Tripura is a blossoming green campus spread over 32 acres and is nearest to the state capital Agartala. The university is a member of the Association of Indian Universities (AIU), New Delhi, the Federation of Universities, India and the Association of Commonwealth Universities, London. Consequently, these universities can confer degrees at Bachelor’s, Master’s and Doctoral levels.
Presently the university has following faculties- Faculty of Management Studies; Faculty of Science and Technology; Faculty of Education, and Faculty of Law. The ICFAI University, Tripura is committed to provide new career-oriented educational programs at Bachelor's and Master's level in management, finance, science and technology, education and other areas. University offered the following programmes in Bachelor's and Master's level-
§ Undergraduate Programmes: BBA, BCA, B.Tech, B.Tech (lateral), B. Ed, LLB, B.Lib, BBA-LLB.
§ Postgraduate Programmes: MBA, MBA (Rural Management), Executive MBA, MCA, BCA-MCA Integrated, MA (Education), LLM.
§ Ph.D programme: Management
The university has received the approval of National Council for Teacher Education (NCTE) to offer a Bachelors Program in Education. The Distance Education Council (DEC) has approved the programs of the university. The Bar Council of India has given its approval for three year and five year Law Courses to award degrees in law.
[1]IGB: Index of Gender Bias. IGB in wage payment has been calculated as the ratio of female wage to male wages. Smaller ratio indicates high gender bias.
[2] In the year 1999-00, absolute wage of the adult casual male and female agricultural workers in the rural and urban areas are Rs 40.45, 28.56, 49.72 and 32.23 respectively and CPIAL is 309 (base 1986-87=100).We inflated the absolute wage by CPIAL to get real wage for rural males and females. Similarly, we inflated absolute wages of urban workers by CPIIW (=433.33base 1982=100)) in 1999-00 to get real wage for urban male and female workers. Similarly we calculate real wages for rural males and females and for the urban males and females by using absolute wages and CPIAL (=530, base 1986-87=100) for rural areas and CPIIW (=777.42 base 1982=100) for urban areas for 2009-10.These values of real wages are then used to calculate growth rate of real wages.
· Assistant Professor, The Institute of Company Secretaries of India-(ICSI-CCGRT), Navi Mumbai.